Introduction
Welcome to our next lesson in the Analyze phase. In our previous session, we focused on ANOVA, a powerful tool for comparing the means of a continuous variable across three or more categorical groups (like comparing the average part strength across different suppliers). We saw how ANOVA helps us pinpoint whether a factor like Supplier has a significant impact on a continuous outcome.
But what happens when the data you're analyzing is entirely categorical? For instance, imagine you're tracking defect types (e.g., 'Scratch', 'Crack', 'Dent') and you want to see if certain defects are more common on specific production shifts (e.g., 'Day', 'Night'). Here, both your input (Shift) and your output (Defect Type) are attribute data, not continuous measurements. This is a common scenario in manufacturing, and for this, we need a different statistical tool.
This lesson addresses the learning outcome: Apply chi-square tests to analyze attribute data, such as defect counts by category. We will focus on the Chi-Square Test of Independence, which allows you to determine if a statistically significant relationship exists between two categorical variables. This is a fundamental skill for root cause analysis, helping you validate or disprove suspected relationships using count data.
Understanding the Chi-Square Test
At its core, the Chi-Square () test is designed to analyze categorical data. It works by comparing the actual counts you observed in your sample (the Observed frequencies) with the counts you would expect to see if there were no relationship at all between the variables (the Expected frequencies).
If the observed counts are very different from the expected counts, the Chi-Square statistic will be large, leading to a small p-value. This indicates that the difference is unlikely to be due to random chance, and we can conclude that a significant relationship exists.
There are a couple of types of Chi-Square tests, but for our purposes of comparing two categorical factors, we will focus on the Chi-Square Test of Independence.
Chi-Square Test of Independence - Six Sigma Study Guide
To start, let's get a clear definition of the Chi-Square Test of Independence and its role in a Six Sigma project. This article from the Six Sigma Study Guide frames the topic perfectly for our needs.
Please read the introduction, the 'When to use' section, and the 'Hypotheses' section. This will solidify why this test is a key tool in the Analyze phase.
Applying the Chi-Square Test of Independence: A Step-by-Step Example
The best way to understand the Chi-Square test is to apply it to a practical manufacturing scenario. We'll use the example from the article you just reviewed, which is highly relevant to your work.
Scenario: A manufacturing team wants to know if the type of defect that occurs is independent of the production shift ('Day' vs. 'Night'). They collect data on 60 defects, categorizing them by type and shift.
The data is organized into a contingency table, which is the standard format for a Chi-Square analysis.
Chi-Square Test of Independence - Six Sigma Study Guide
Let's review the setup for our manufacturing example from the 'Six Sigma Study Guide' article.
Read the section 'Independence Test Example: Process Defects by Shift'. Pay close attention to the contingency table showing the observed counts. This table is our starting point.
Now, let's walk through the formal hypothesis testing procedure.
Step 1: State the Hypotheses
As with all hypothesis tests, we start with a null and an alternative hypothesis. For a test of independence, they are always framed as:
- Null Hypothesis (H₀): The two variables are independent.
- In our example: Defect type is independent of the production shift.
- Alternative Hypothesis (H₁): The two variables are not independent (they are associated).
- In our example: Defect type is associated with the production shift.
Our goal is to see if we have enough evidence to reject the null hypothesis in favor of the alternative. We'll use a standard significance level of .
Step 2: Calculate the Expected Frequencies
This is the most critical step. We need to calculate what the counts in each cell of our contingency table would be if the null hypothesis of independence were true.
The formula for the expected count (E) in any cell is:
The intuition is that if the variables are independent, the proportion of each defect type should be the same for both shifts.
Let's watch a video that provides an excellent walkthrough of this calculation and the logic behind it.
Chi-square test for association (independence) | AP Statistics | Khan Academy
This Khan Academy video, 'Chi-square test for association (independence)', clearly demonstrates how to calculate the expected values and explains the reasoning.
Watch from 02:47 to 07:03. Focus on understanding the formula and how it's applied to each cell in the table. The example is different, but the principle is exactly the same as our manufacturing scenario.
Step 3: Calculate the Chi-Square Statistic ()
The statistic measures the total discrepancy between the observed (O) and expected (E) counts across all cells in the table.
The formula is:
You calculate for each cell and then sum them all up. A larger value indicates a greater difference between your data and what you'd expect under independence.
Step 4: Determine Degrees of Freedom and Find the P-value
-
Degrees of Freedom (df): This determines the shape of the Chi-Square distribution we compare our statistic against. For a test of independence, the formula is simple:
For our 2x3 table (2 shifts, 3 defect types), df = (2-1) * (3-1) = 2. -
P-value: In practice, you will use statistical software to get a p-value from your calculated statistic and degrees of freedom. The p-value represents the probability of observing a value as large as you did (or larger), assuming the null hypothesis is true.
Step 5: Make a Conclusion
This follows the same rule as all our previous hypothesis tests:
- If p-value < (e.g., < 0.05), you reject the null hypothesis. You have statistically significant evidence of an association between the variables.
- If p-value ≥ , you fail to reject the null hypothesis. You do not have enough evidence to conclude that an association exists.
Let's see the full calculation and conclusion for our manufacturing example.
Chi-Square Test of Independence - Six Sigma Study Guide
Now, let's put all the pieces together. This section of the 'Six Sigma Study Guide' walks through steps 2 through 5 using our defect data.
Read from 'Step 1 – Hypotheses' through 'Step 8 – Conclusion'. Trace how the expected counts are calculated, how they are used to find the χ² statistic (6.67), and how this value leads to the final conclusion by comparing it to a critical value (which is equivalent to finding a p-value < 0.05).
Interpreting the Results for Action
The conclusion from the example was to reject the null hypothesis. The p-value was less than 0.05, meaning there is a significant association between the production shift and the type of defect.
But as a Six Sigma practitioner, your job isn't done. The test tells you that a relationship exists, but not what that relationship is. To turn this statistical finding into a practical insight, you must go back to the data.
Compare the Observed counts to the Expected counts for each cell.
- The Day Shift had 16 Type A defects, but we only expected 12.
- The Night Shift had 12 Type B defects, but we only expected 8.
This tells you exactly where to focus your investigation. The team should investigate why the Day Shift produces a disproportionately high number of Type A defects and why the Night Shift struggles with Type B defects. This could be due to differences in operator training, machine setup, or environmental conditions between the shifts.
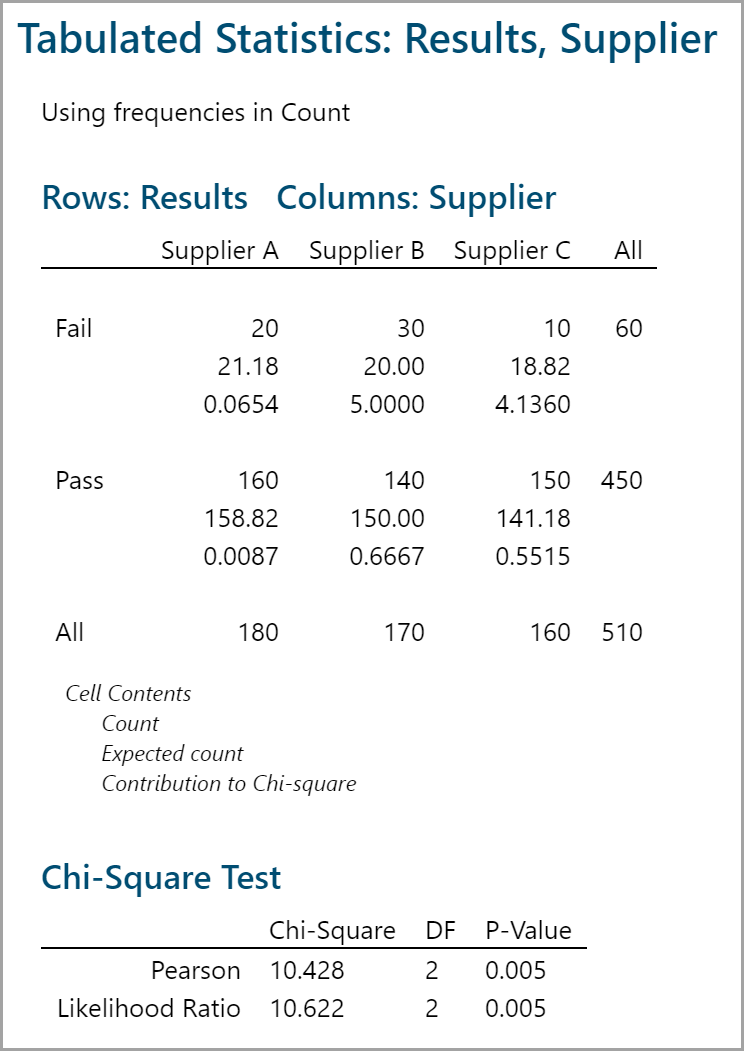
The image below shows a typical output from statistical software like Minitab. Notice how it provides the observed count, the expected count, and the contribution of each cell to the overall Chi-Square statistic. This makes it easy to spot the cells with the largest discrepancies.
Conclusion
You have now added another essential hypothesis test to your toolkit. While t-tests and ANOVA are your go-to tools for continuous data, the Chi-Square test is your primary method for analyzing attribute or categorical data. It provides a structured way to determine if a relationship exists between two categorical factors, such as defect types, production lines, suppliers, or inspection results.
Key Takeaways:
- The Chi-Square Test of Independence is used to determine if there is a statistically significant association between two categorical variables.
- The test works by comparing observed counts in a contingency table to the expected counts that would occur if the variables were independent.
- The decision is based on the p-value: if p < 0.05, you reject the null hypothesis and conclude that the variables are related.
- A significant result is just the start. The real value comes from interpreting the result by comparing observed vs. expected counts to understand the nature of the relationship and guide your root cause analysis.
Preview of the Next Lesson:
So far in this module, we have covered hypothesis tests that involve at least one categorical variable (t-tests, ANOVA, and Chi-Square). In our next module, we will shift our focus to exploring the relationship between two continuous variables. We will begin by learning how to visualize this relationship using scatter plots and quantify its strength with the correlation coefficient, which are the first steps into the world of regression analysis.