Hello! Welcome back to our module on "The Language of Causation."
In our last lesson, we established the philosophical motivation for Structural Causal Models (SCMs). We learned that SCMs are not just statistical summaries but are models of autonomous causal mechanisms, and that an intervention, represented by the do-operator, is a "surgical" modification of this model. This approach is guided by the principle of "Representation first, discovery second"—we start with a theory of how the world works.
Today, we'll build directly on that foundation. Our learning outcome is to interpret directed acyclic graphs (DAGs) as expressions of qualitative causal assumptions, distinct from statistical models. We will explore how DAGs provide a powerful visual language to express the structure of SCMs and why this causal diagram is fundamentally different from a graph of statistical correlations.
1. From Equations to Pictures: Visualizing Causal Structure
In the previous lesson, we saw that an SCM is a collection of equations, like . While these equations provide a complete, quantitative description of a causal system, they can be complex. Often, we first want to reason about the system's qualitative structure: which variables cause which other variables, without specifying the exact mathematical form of the relationship.
This is precisely the role of a Directed Acyclic Graph (DAG). A DAG is the graphical counterpart to an SCM.
Causal Models - Stanford Encyclopedia of Philosophy
The Stanford Encyclopedia of Philosophy provides a concise explanation of how a DAG relates to a Structural Equation Model. This will help formalize the connection between our last lesson and this one.
Please read the short section 3.1 Introduction to SEMs. Focus on how the system of equations for the gas grill is translated into the DAG in Figure 3. Pay special attention to the concluding sentence: 'The graph contains strictly less information than the set of equations...the DAG gives us qualitative information about which variables depend upon which others, but it does not tell us anything about the functional form of the dependence.'
As the reading makes clear, the DAG strips away the quantitative details of the functions (f_j) and focuses solely on the causal architecture. An arrow from X to Y in a DAG simply means that X is an argument in the structural equation for Y.
This image provides a perfect illustration of this relationship:
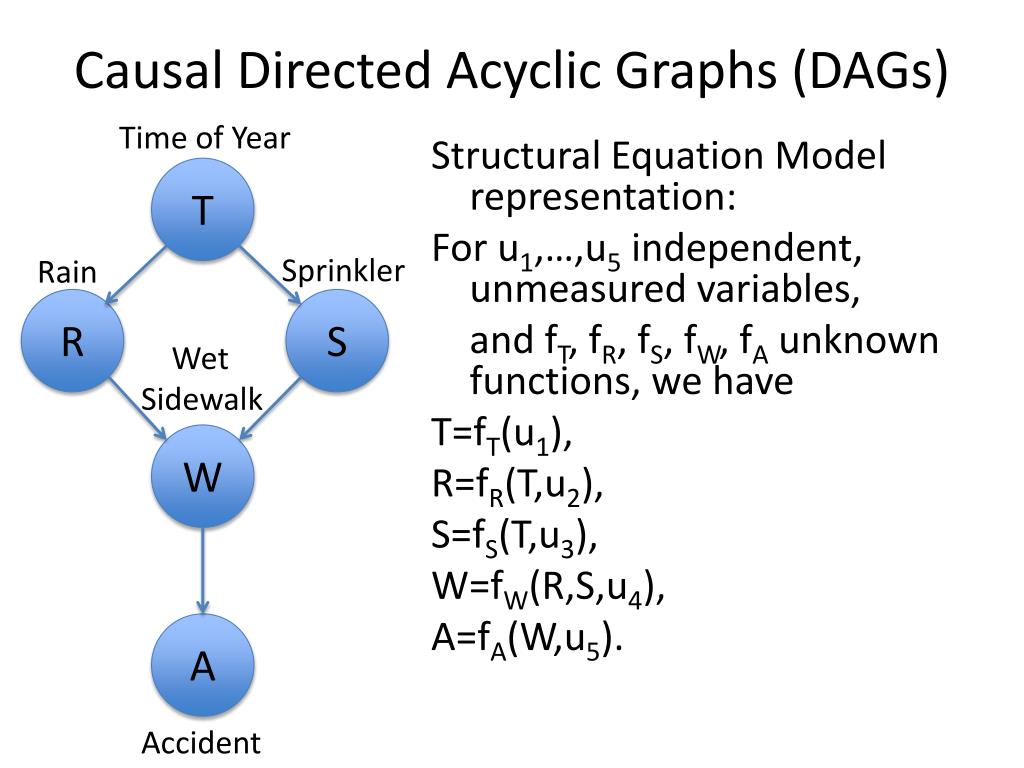
2. The Grammar of DAGs: Encoding Causal Assumptions
To interpret a DAG correctly, we need to understand its basic grammar. A DAG consists of:
- Nodes (or vertices): These represent the variables in our model (e.g.,
Rain,Sprinkler). - Arrows (or edges): A directed arrow from node
Xto nodeYrepresents the assumption thatXis a direct cause ofY, relative to the other variables in the model. - Acyclicity: You can never follow a path of arrows that leads from a node back to itself. This reflects the intuitive assumption that events cannot cause themselves.
The power of a DAG lies not just in the arrows it includes, but also in the ones it leaves out.
Causal inference—so much more than statistics - PMC
This article from the International Journal of Epidemiology explains the key features of DAGs and highlights the importance of missing arrows.
Please read the section Directed acyclic graphs (DAGs), including Box 1. Focus on the meaning of arrows and, especially, the meaning of the absence of an arrow. As the text states, 'the absence of an arrow is as important as the presence of one.'
This is a crucial philosophical point. A statistical correlation matrix will almost always be dense, with some non-zero correlation between most pairs of variables. A DAG, in contrast, is typically sparse. By omitting an arrow from, say, Sprinkler to Accident, we are making the strong causal claim that the sprinkler does not directly cause an accident, even if they might be statistically correlated. The DAG forces us to be explicit about our causal hypotheses.
3. Why a DAG is Not a Statistical Model
Your background in statistics and probability theory makes you familiar with graphical models that represent statistical dependencies, like Bayesian networks. It's vital to distinguish these from DAGs used for causal inference.
A Bayesian network is a representation of a joint probability distribution. It tells you about conditional dependencies—which variables become independent when you know the value of another. A causal DAG does more: it makes claims about what happens when you intervene on the system.
Let's hear Judea Pearl make this distinction himself.
Judea Pearl: Causal Networks | AI Podcast Clips
In this clip, Judea Pearl, the architect of this framework, discusses the transition from purely statistical Bayesian networks to causal networks.
Please watch from the beginning to 01:49. Notice how he frames the problem: how do we turn a Bayesian network (expressing statistical dependencies) into a causal network (expressing 'A causes B')? His answer is that causality comes from a 'theory' provided by a human expert—a qualitative model of 'who listens to whom.'
Pearl's key idea is that the causal assumptions encoded in a DAG are extra-statistical. They cannot be derived from the data alone. We need to bring in outside knowledge or theory about the data-generating process.
The classic example illustrating this is Simpson's Paradox.
Causal inference—so much more than statistics - PMC
Let's revisit the PMC article, which uses Simpson's Paradox to brilliantly illustrate why a causal story (the DAG) is essential and why statistics alone is insufficient.
Please read the section The relationship between causality and statistics–Simpson’s Paradox and the importance of context. The scenario presents two datasets with identical numbers. In one case, stratification is correct; in the other, it's wrong. The only thing that tells us what to do is the causal story behind the variable (gender vs. post-treatment blood pressure).
This example makes it clear: the statistical information P(Recovery|Drug, Gender) is identical to P(Recovery|Drug, BP). But the causal structures are different.
Genderis a common cause ofDrug(treatment choice) andRecovery. This is a confounding path.Blood Pressureis a common effect of theDrugand an underlying illness that also affectsRecovery. This is a collider path, a concept we will explore next.
The DAG makes these different causal stories explicit, telling us how to interpret the same statistical patterns.
4. Reading the Causal Story: Paths in a DAG
A DAG tells a causal story through its paths. A path is any sequence of connected nodes, regardless of arrow direction. The way arrows are oriented along a path determines how statistical association flows between variables. Understanding this is the key to interpreting a DAG.
Introduction To Causal Inference And Directed Acyclic Graphs
This video provides an excellent and clear introduction to the three fundamental types of paths in a DAG and how they relate to statistical association. It will equip you with the tools to read the causal assumptions embedded in any DAG.
Please watch from 31:19 to 43:51. This segment covers several key concepts: DAG Basics (31:19 - 34:12): A quick review of what a DAG is and what an arrow means ('Y listens to X'). Paths and Conditioning (34:12 - 38:25): Introduces the idea of open vs. closed paths, and defines the crucial confounding (or backdoor) path. It explains how conditioning on a variable on this path can block the association. Colliders (38:25 - 43:51): Defines the collider path and explains the counter-intuitive result that conditioning on a collider opens a path and can create a spurious association. The examples of ice cream/sharks (confounding) and the 'mediocre white male problem' (collider bias) are particularly helpful for building intuition.
Let's summarize the key ideas from the video:
- Causal Path: A directed path
X → ... → Y. This is how a change inXcan cause a change inY. This path is naturally open. - Confounding Path (Backdoor): A path like
X ← C → Y. Here,Cis a common cause. This path creates a non-causal statistical association betweenXandYbecause whenCvaries,XandYvary together. This path is naturally open, but is closed by conditioning onC. - Collider Path: A path like
X → Z ← Y. Here,Zis a common effect (a "collider"). This path does not create an association betweenXandY. It is naturally closed. However, if we condition on the colliderZ, we open the path and can create a spurious statistical association betweenXandY.
Your experience as a social researcher on relationships provides fertile ground for thinking about these structures. For instance, in polyamorous networks, a person's happiness (Z) might be a collider, influenced by the quality of their relationship with partner X and partner Y. In the general population, the quality of these two relationships might be independent. But if you were to study only very happy people (conditioning on the collider Z), you might find a spurious negative correlation: given high happiness, a great relationship with X might 'explain away' the need for a great relationship with Y.
Conclusion
In this lesson, we have transitioned from the abstract equations of SCMs to the intuitive, qualitative language of Directed Acyclic Graphs.
Key Takeaways:
- DAGs as Qualitative Models: A DAG is the graphical representation of an SCM's structure, showing the presence and, crucially, the absence of direct causal relationships.
- Distinct from Statistical Models: A DAG is not a model of correlations; it is a model of hypothesized causal mechanisms. It contains extra-statistical information that is essential for causal inference, as demonstrated by Simpson's Paradox.
- The Language of Paths: The causal story in a DAG is read through its paths. Causal paths, confounding paths, and collider paths have different properties that determine how statistical association is transmitted or blocked between variables.
- Conditioning's Dual Role: Conditioning on a variable can either block a confounding path (removing bias) or open a collider path (introducing bias). A DAG makes it possible to distinguish between these two cases.
In our next lesson, we will focus on the second rung of the Ladder of Causation: intervention. We will formally define the do-operator and explore why the distinction between seeing, P(Y|X), and doing, P(Y|do(X)), is so philosophically fundamental to this entire framework.