Introduction
In our last lesson, you successfully created your first set of charts, turning raw data summaries into visual representations of trends and comparisons. While creating a chart is a great first step, a default chart from Google Sheets is rarely ready for a professional report. It's like a rough draft that needs editing.
This lesson focuses on that crucial editing process. We will dive into how to customize your charts to make them clear, professional, and easy to understand. You'll learn to add and format titles, place informative labels, use color effectively, and add annotations to highlight key points in your data's story. For your freelance work, these skills are what elevate a simple data task into a polished, client-ready analysis.
1. The Customization Hub: Titles, Axes, and Colors
Once a chart is created in Google Sheets, most of your customization work will happen in the Chart editor pane, under the Customize tab. The key to effective customization is to ensure every element on the chart serves a purpose and adds to the clarity of the message.
The main elements you'll want to control are:
- Chart & Axis Titles: These tell your audience what they are looking at. A chart without a title is like a book without a cover.
- Series: This refers to your actual data (the bars, lines, or pie slices). Changing colors can help draw attention or align with a client's brand.
- Legend: The key that explains what each color or symbol represents.
- Gridlines & Ticks: These help the viewer trace data points back to the axes.
The following video provides a great walkthrough of the "Customize" tab in Google Sheets. It will help you get familiar with where to find these essential options.
Google Sheets Charts / Graphs Tutorial
This video from "Learn Google Sheets & Excel Spreadsheets" demonstrates the fundamental customization options available in the Google Sheets chart editor.
Please watch these clips to see the customization panel in action: First, see how to open the customize tab from this short clip. Next, watch how to modify the chart title's font and size. Finally, see how to change the color of your data series (the bars in this case).
The Importance of Axis Titles
While the video focused on the main chart title, adding titles to your axes is just as important. An axis with numbers but no label forces the reader to guess what those numbers mean. Is it dollars, units sold, or something else? You must eliminate this ambiguity.
Although the following video uses Excel, it perfectly explains the thought process behind adding axis titles for clarity. The principle is identical in Google Sheets.
Excel Charts and Graphs Tutorial
This video by Kevin Stratvert clearly demonstrates why axis titles are essential for a chart to make sense.
Watch the section from this clip where the presenter realizes the vertical axis is unclear and adds an "Axis Title" to label it "number of cookies sold." In Google Sheets, you'll find this option in the Customize > Chart & axis titles menu.
2. Adding Clarity with Data Labels and Annotations
Titles and colors set the stage, but data labels and annotations deliver the specific insights. They point directly to the numbers and stories in your data.
Data Labels
Data labels display the exact value of a data point directly on the chart (e.g., on top of a bar or next to a point on a line). This saves your audience from having to estimate values by looking at the gridlines.
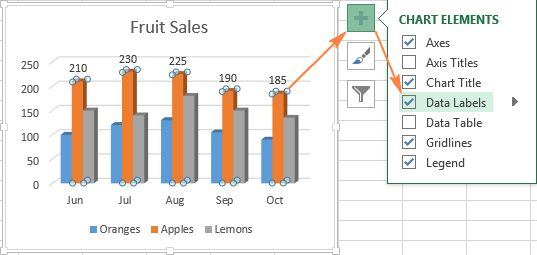
You can easily add these in Google Sheets. The following guide from Google's official help center shows you how.
Add data labels, notes, or error bars to a chart - Google Help
This official Google Help article provides step-by-step instructions for adding and editing data labels in Google Sheets.
Read the steps under the sections "Add data labels" and "Edit data labels". Notice that you can edit an individual label by double-clicking it, which is useful for highlighting just one or two key values.
A pro-tip for clean, professional charts is to use direct labeling where possible. Instead of relying on a separate legend, you can label the data series itself. This reduces the mental effort for the reader.
Directly Labeling in Excel - Evergreen Data
This article from Evergreen Data explains the "why" behind direct labeling, arguing that it's a superior alternative to legends.
Read the first few paragraphs, from the introduction down to the core idea. The key takeaway is that legends put a "burden on the reader to seek and match up" information, which we want to avoid. While the technical steps are for Excel, the principle is universal.
In Google Sheets, you can achieve this by adding a data label to just the last point of a line chart and editing the label text to be the series name.
Annotations (Notes)
Sometimes, you need to explain why a certain data point is interesting. An annotation is a small note on the chart that provides context. For example, you could add a note to a sales chart that says "New marketing campaign launched" to explain a sudden spike.
The Google Help article you just reviewed also explains how to add these notes. It involves adding a new column in your source data for the note text.
Add data labels, notes, or error bars to a chart - Google Help
This section of the Google Help article explains how to add annotations to your chart.
Review the section "Add notes to a chart". Pay close attention to the example table showing a "Notes" column next to the data. This is how Google Sheets links your comments to specific data points.
3. Hands-On Practice
It's time to apply these techniques. Please open the practice workbook you used in the previous lesson, which should contain the charts you created. We will focus on improving the line chart showing monthly sales trends.
Follow these steps to transform your basic chart into a professional one:
- Select your line chart. Double-click it to open the Chart editor pane.
- Add Titles:
- Go to the
Customizetab. - Click on
Chart & axis titles. - Change the
Chart titleto something more descriptive, like "2023 Monthly Sales Trend". - Change the
Title textfor theVertical axis titleto "Total Sales (USD)".
- Go to the
- Add Data Labels:
- In the
Customizetab, go toSeries. - Check the box for
Data labels. This will add labels to every point. - To make it cleaner, let's only highlight the highest month. First, uncheck
Data labelsto remove them all. Then, find the highest point on your chart, and double-click just that single data point. The Chart editor should now show you are formatting only that point. Now checkData labelsagain. The label should appear for only that single point.
- In the
- Add an Annotation:
- Go to the pivot table that is the source for your chart.
- Find the month with the highest sales (e.g., November or December).
- In the spreadsheet column right next to your pivot table's sales figures, type a note in the cell corresponding to that month. For example: "Start of Holiday Shopping Season".
- Now, double-click your chart. In the
Setuptab of the Chart editor, adjust yourData rangeto include this new column with your note. A small annotation marker should appear on the chart. Note: If this doesn't work easily with the pivot table, you can copy the pivot table data and paste it as values into a new area, then add the notes column there and create the chart from this new static data.
Once you've finished, your chart should look much more informative and professional than the default version.
Conclusion
You've now learned the essential skills for turning a basic chart into a powerful tool for communication. A well-customized chart not only looks more professional but also guides your audience to the most important insights, preventing confusion and making your findings more impactful.
Here are the key takeaways from this lesson:
- The Customize tab in the Google Sheets Chart editor is your central hub for all formatting.
- Clear titles for the chart and its axes are non-negotiable; they provide essential context.
- Data labels show exact values, while annotations explain the "why" behind the data.
- Aim for clarity above all. A simple, well-labeled chart is always better than a complicated, confusing one.
In our next lesson, you will learn how to take your finished chart and write a concise summary that interprets the data and highlights the key takeaways for a client. This is the final step in packaging your analysis for a report.