Introduction
In our last lesson, you learned how to systematically identify outliers in a dataset using sorting, conditional formatting, and the IQR method. While highlighting numbers in a table is effective, one of the most powerful ways to spot unusual data and understand broad patterns is through visualization. For a data researcher, presenting findings visually is a core skill that makes your insights more impactful for clients.
This lesson focuses on translating raw data into meaningful charts. We will cover how to select the right type of chart—specifically bar, line, and pie charts—based on what you want to show, and then you'll get hands-on practice creating these charts directly in Google Sheets. This will bridge the gap between analyzing data and communicating your findings clearly.
1. From Numbers to Narratives: Why We Visualize Data
Before diving into how to make charts, let's consider why. A table of numbers is precise, but a chart tells a story. It can reveal trends, comparisons, and relationships in a way that is instantly understandable.
Take a look at the image below. It's a dashboard created in Google Sheets. Imagine trying to understand the same information just by looking at the raw data tables. It would be far more difficult to quickly grasp the monthly performance, daily fluctuations, or quarterly breakdown.
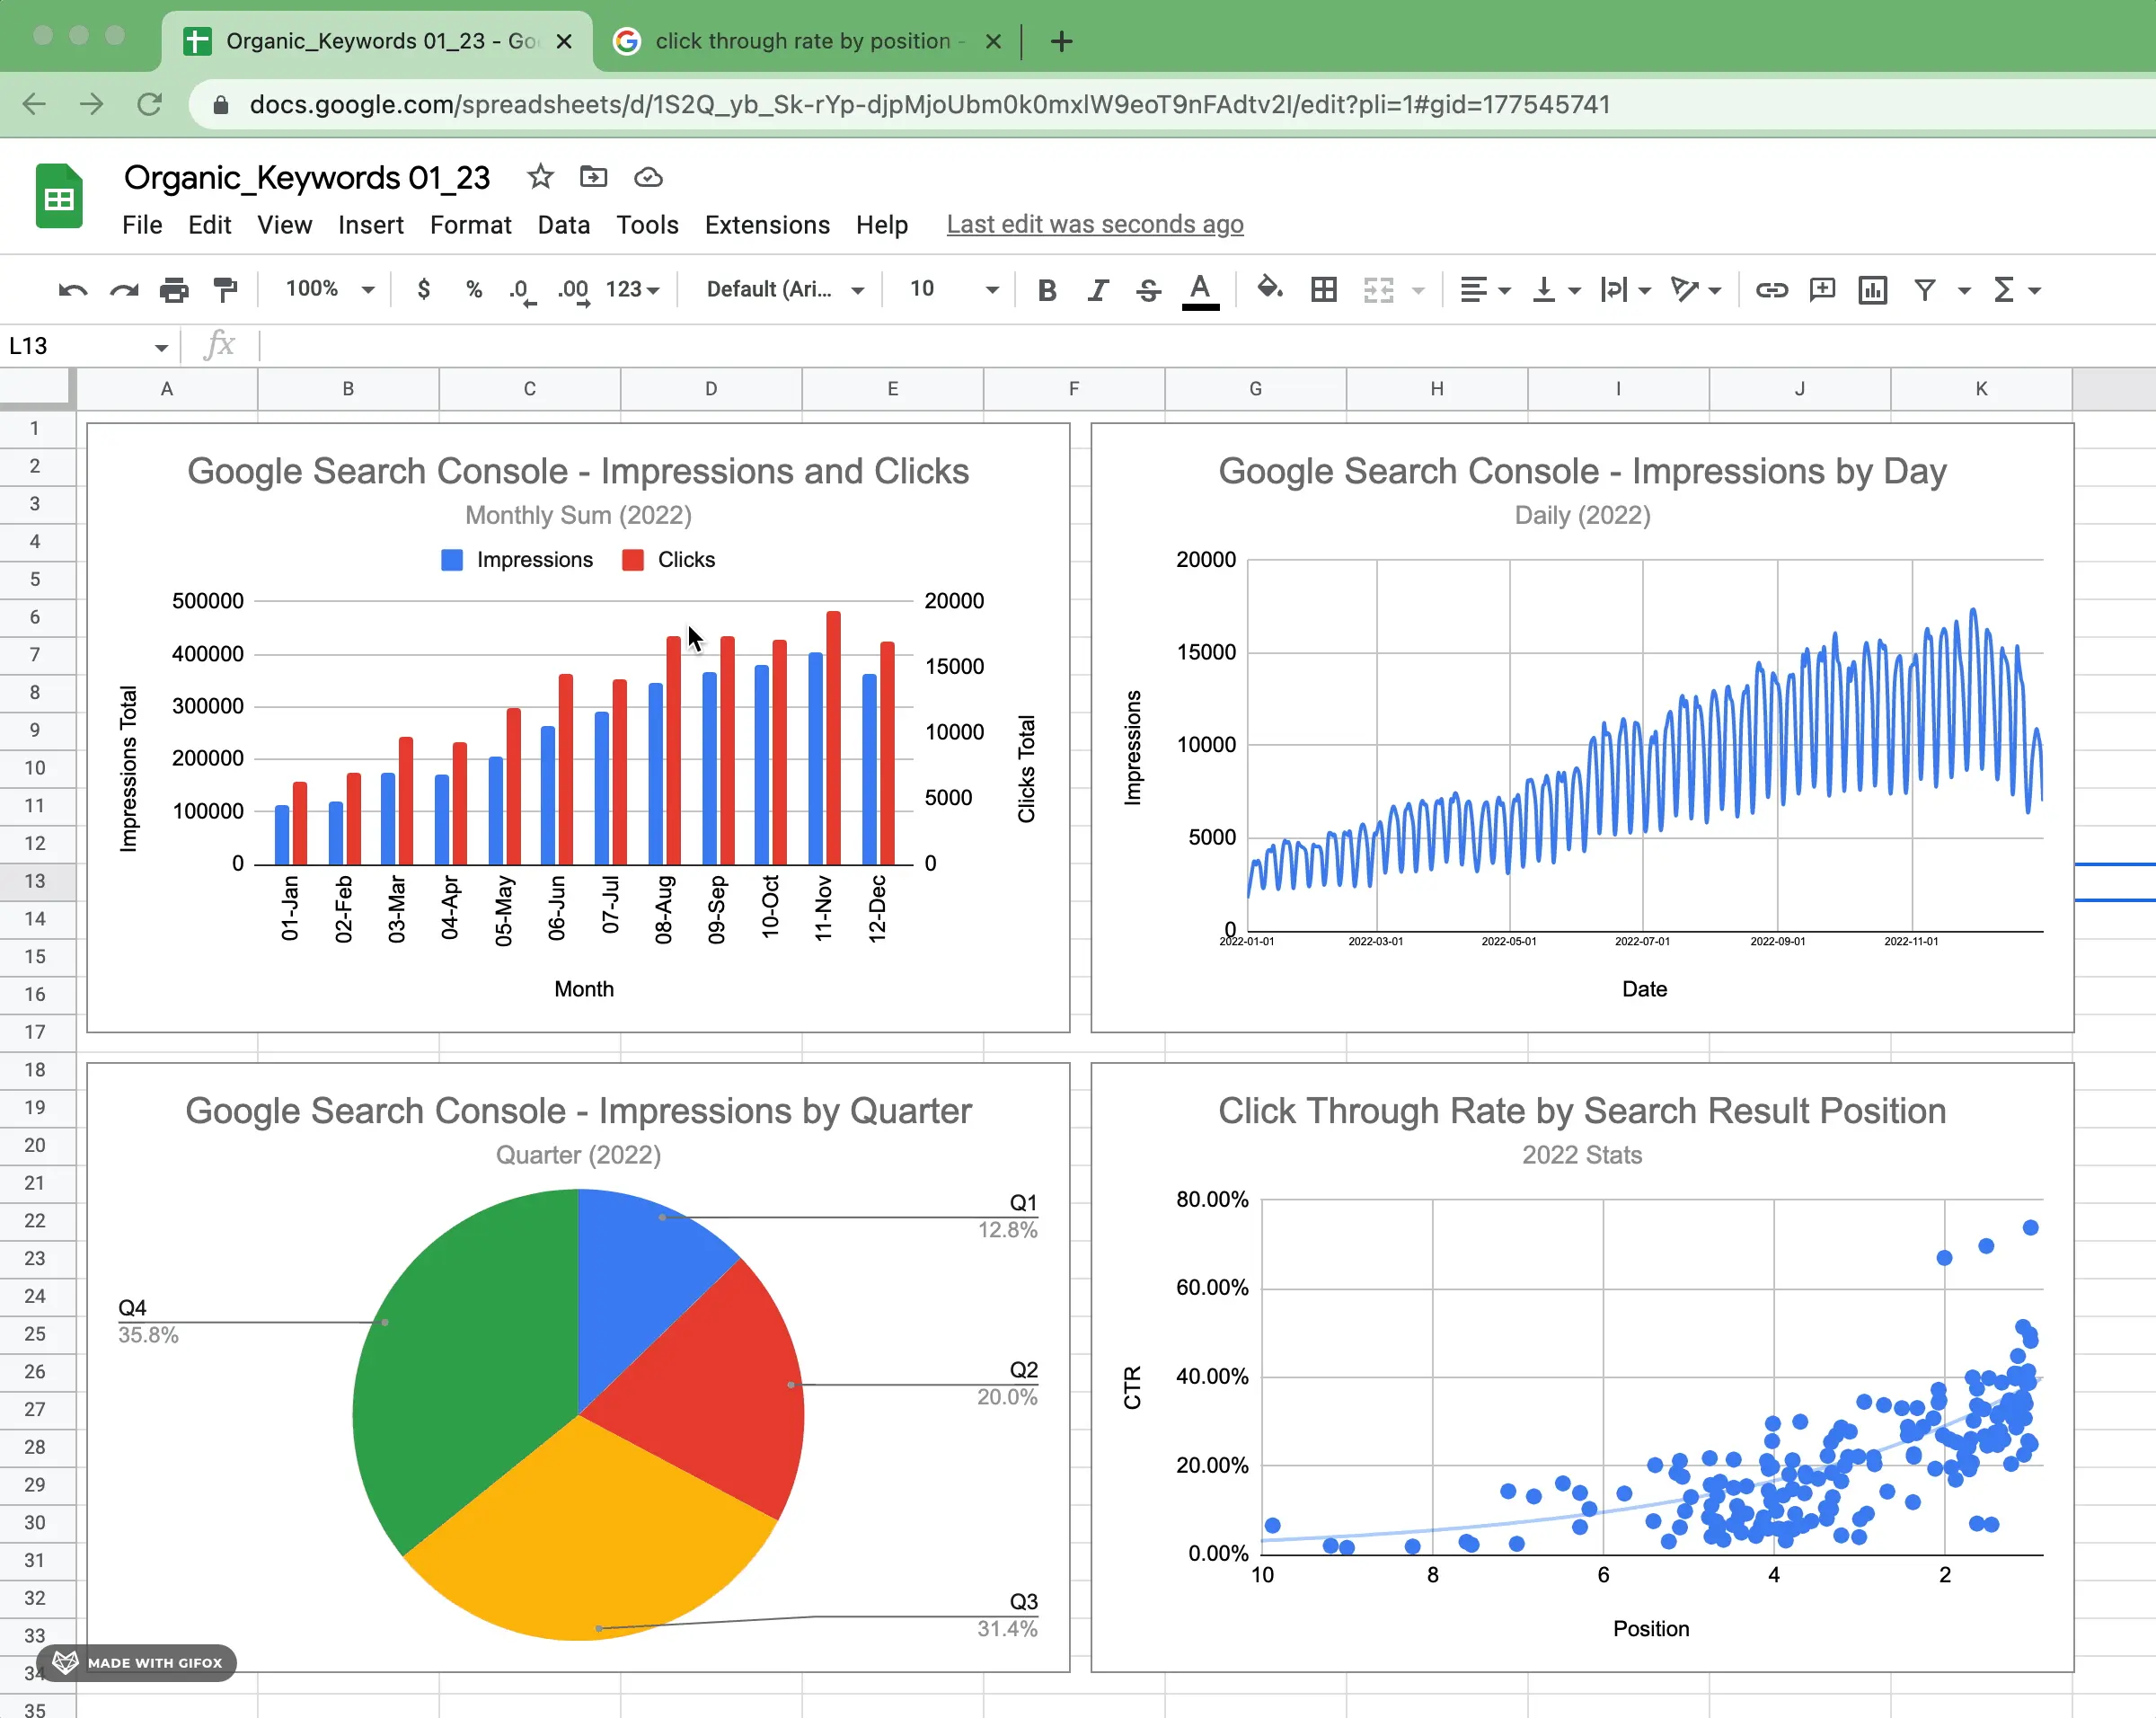
Your goal as a data researcher isn't just to find data, but to extract meaning from it. Charts are your primary tool for this.
2. Choosing the Right Chart for Your Data
The most common mistake beginners make is choosing a chart type based on what looks nice, rather than what best communicates the data's story. The chart you choose depends entirely on your goal. This flowchart provides a fantastic mental model for making that decision.

As the flowchart shows, your first question should always be: "What would I like to show?"
- Do you want to compare values against each other? (e.g., sales per product)
- Do you want to show the composition of something, or parts of a whole? (e.g., market share per region)
- Do you want to show how data is distributed? (e.g., age groups of customers)
- Do you want to show a relationship between variables? (e.g., does advertising spend correlate with sales?)
- Do you want to show a trend over time?
The following video provides an excellent overview of the five most common chart types and when to use them. Pay close attention to the reasoning behind each choice.
How To Choose The Right Graph (Types of Graphs and When To Use Them)
This video from the channel UNDATABLE clearly explains the best use cases for the charts you'll use most often.
Please watch the following segments: Bar Charts: For comparing categories. Pie Charts: For showing part-to-whole relationships (composition). Notice the warnings about their limitations! Scatter Plots: For showing the relationship between two different variables. Line Charts: For showing changes over a continuous period, like time.
To summarize the key points from the video:
| If you want to... | Use a... | Example |
|---|---|---|
| Show how a value changes over time | Line Chart | Tracking website traffic over a year. |
| Compare discrete categories | Bar Chart | Comparing sales figures across different products. |
| Show the composition (parts of a whole) | Pie Chart | Showing the percentage of votes for each candidate. |
| Show the relationship between two variables | Scatter Plot | Seeing if there's a link between height and weight. |
A key insight for a professional is that "boring" charts like bar and line charts are often the most effective. They are easy for everyone to read and understand, which makes your message clearer. Fancy, complex charts can sometimes obscure the very point you are trying to make.
3. How to Create a Chart in Google Sheets
Now for the practical part. Creating a chart in Google Sheets is a straightforward process. The general workflow is:
- Select the data you want to visualize.
- Go to the Insert menu and choose Chart.
- Google Sheets will automatically suggest a chart type, but you can change and customize it using the Chart editor pane that appears.
The following article from Ablebits.com walks through this process.
This guide provides clear, step-by-step instructions for creating your first chart in Google Sheets.
Read the section titled "How to Make a Chart". Focus on the core steps of selecting your data range (including headers) and using the Insert > Chart menu.
The process is very similar in other spreadsheet software like Excel. While you're focused on Google Sheets, it's useful to see how universal this skill is. This next video shows the process in Excel. Notice how the core steps—selecting data, inserting a chart, and using an editor pane—are nearly identical.
Excel Charts and Graphs Tutorial
This video demonstrates the fundamental process of creating and modifying charts, with principles that apply directly to Google Sheets.
Watch these two short clips: Inserting a chart: Observe how Excel also has a "Recommended Charts" feature, similar to Google Sheets' automatic suggestion. Changing the chart type: See how easily you can switch from a line chart to a column chart after it has been created.
4. Hands-On Practice
It's time to apply what you've learned. We will use the same sales dataset from our previous lessons. A crucial step in creating summary charts is to first aggregate your data. As you learned in lesson 6.1, pivot tables are the perfect tool for this.
Open your practice workbook and navigate to the "Data" sheet.
Practice Problem 1: Visualizing Sales Trends Over Time
Your goal is to show the trend of total sales Amount for each month.
- Choose the Chart Type: You want to show how a value changes over time. Based on what you've learned, which chart type is most appropriate? (You should be thinking of a Line Chart).
- Summarize the Data:
- Create a new Pivot Table. Use the
Data!A1:F1001range. - For
Rows, add theDatefield. Right-click on any date in the pivot table and selectCreate pivot date group > Year-Month. - For
Values, add theAmountfield, summarized bySUM.
- Create a new Pivot Table. Use the
- Create the Chart:
- Select the data in your new pivot table (the months and the sum of amounts).
- Go to
Insert > Chart. Google Sheets should automatically create a line chart for you. If it doesn't, select "Line chart" from the Chart editor's "Setup" tab.
Practice Problem 2: Comparing Product Performance
Your goal is to compare the total sales Amount for each Product.
- Choose the Chart Type: You are comparing values between discrete categories. What's the best choice? (A Bar Chart or Column Chart is ideal).
- Summarize the Data:
- Create another Pivot Table.
- For
Rows, add theProductfield. - For
Values, add theAmountfield, summarized bySUM.
- Create the Chart:
- Select the data in your pivot table (products and their total sales).
- Go to
Insert > Chart. Google Sheets will likely suggest a bar or column chart. If you want to switch between them, you can easily do so in the Chart editor.
Practice Problem 3: Showing Regional Sales Composition
Your goal is to show what proportion of total sales comes from each Region.
- Choose the Chart Type: You need to show parts of a whole. What chart should you use? (A Pie Chart is the classic choice here).
- Summarize the Data:
- Create a third Pivot Table.
- For
Rows, add theRegionfield. - For
Values, add theAmountfield, summarized bySUM.
- Create the Chart:
- Select your summarized data (regions and their sales totals).
- Go to
Insert > Chart. - In the Chart editor, under
Chart type, scroll down and selectPie chart.
Conclusion
In this lesson, you've taken a major step in your data analysis journey. You've learned that effective visualization is not about decoration, but about clear communication. Choosing the right chart is a matter of first defining the story you want to tell.
Here are the key takeaways:
- Purpose drives selection: Use line charts for trends over time, bar charts for comparing categories, and pie charts for showing the composition of a whole.
- Simple is often better: Standard chart types are universally understood and are powerful tools for clear communication.
- Summarize first: For large datasets, you almost always need to summarize your data (e.g., with a pivot table) before creating a meaningful chart.
- Creation is simple: The process in Google Sheets involves selecting your summary data and using the
Insert > Chartmenu.
You now know how to create basic charts. However, a default chart is rarely ready for a client report. In our next lesson, we will focus on the crucial final step: customizing your charts with titles, labels, and colors to make them professional, clear, and persuasive.