Introduction
In our last lesson, we explored descriptive statistics and saw how a significant gap between the mean and the median can signal the presence of outliers—unusually high or low values that can skew your analysis. Knowing they exist is the first step, but for freelance data research, you need to be able to pinpoint exactly which data points are the culprits.
This lesson will equip you with practical, hands-on techniques to do just that. We will focus on using two fundamental spreadsheet tools, sorting and conditional formatting, to effectively identify potential outliers in a dataset. Mastering this is a crucial skill for cleaning data and ensuring the insights you provide to clients are accurate and reliable.
1. The Simplest Method: Finding Outliers by Sorting
For smaller datasets, the most straightforward way to spot potential outliers is to simply sort your data and look at the values at the extremes. By arranging the data from smallest to largest (and vice versa), the values that are glaringly different from their neighbors will become immediately obvious.
This approach is less of a formal statistical method and more of a quick-and-dirty visual inspection, but it's a valuable first step in any data exploration process.
How to Find Outliers in Excel (and how to handle these)
This article from TrumpExcel provides a great overview of this simple yet effective technique.
Read the section titled "Find Outliers by Sorting". The example using customer service call durations clearly illustrates how sorting can make extreme values stand out.
The core idea is to look for large "jumps" in value between adjacent cells after sorting. If most of your values increase by small increments and you suddenly see a massive leap, that's a strong indicator of an outlier.
2. A Systematic Rule: The Interquartile Range (IQR) Method
While sorting is useful, it can be subjective. For larger datasets or more rigorous client work, you need a defined, rule-based method to determine what qualifies as an outlier. The most common statistical approach for this is the Interquartile Range (IQR) method.
First, let's solidify our understanding of what outliers are and why they matter.
Finding Outliers In Excel: A Detailed Guide
This guide from Acuity Training gives an excellent practical explanation of outliers and their impact.
Please read the first two sections: What Are Outliers? and Why Is It Important?. The Uber fare example is a perfect real-world illustration of how outliers can lead to incorrect budgeting and decision-making.
The IQR method gives us a mathematical way to define "fences" for our data. Any data point that falls outside these fences is considered a potential outlier. Here's how it's calculated:
- Find the Quartiles: We divide our data into four equal parts, or quartiles.
- First Quartile (Q1): The value below which 25% of the data falls.
- Third Quartile (Q3): The value below which 75% of the data falls.
- Calculate the Interquartile Range (IQR): This is the range that contains the middle 50% of your data.
- Define the Fences: We calculate the upper and lower limits for our data.
- Lower Fence =
- Upper Fence =
Any value in your dataset that is less than the Lower Fence or greater than the Upper Fence is flagged as a potential outlier. The multiplier (1.5) is a standard convention, but it can be adjusted depending on how sensitive you want your outlier detection to be.
3. Highlighting Outliers with Conditional Formatting
Now that we have the upper and lower fence values, we can use conditional formatting to automatically highlight the outliers in our spreadsheet. This makes them instantly visible, even in a dataset with thousands of rows.
This video demonstrates a very direct way to apply this logic.
Formula to Identify Outliers in Excel Data Set | Highlight Outliers
This tutorial from Chester Tugwell walks through calculating the fences and then using conditional formatting to highlight the outliers.
Watch these two segments: First, see how the fences are calculated from 01:13 to 03:17. This will reinforce the IQR method we just discussed. Then, watch how conditional formatting is used to highlight the outliers from 03:22 to 04:10. Pay close attention to the rule he selects: "cell value not between" the lower and upper fences.
While the video uses a specific formula-based approach, Excel and Google Sheets offer simpler, built-in conditional formatting rules that are also useful for spotting extreme values, such as highlighting the "Top 10%" or values "Above Average".
Conditional Formatting in Excel Tutorial
This video from Kevin Stratvert provides a good overview of general conditional formatting rules that can help spot outliers.
Watch the sections on highlighting based on value and on top/bottom rules. These are less precise than the IQR method but are very fast for a quick analysis.
4. A Powerful Workflow: Combining Formulas and Formatting
A very common and powerful technique used by data analysts is to create a "helper column" that flags outliers with a formula. This gives you more control and makes it easy to filter your data later.
Here's the workflow:
- Calculate your Q1, Q3, and IQR values in separate cells.
- Create a new column next to your data, perhaps named "Outlier?".
- In this column, write an
IFformula combined with anORfunction to test if the corresponding data point is an outlier. The logic is:IF(OR(data_cell < lower_fence, data_cell > upper_fence), 1, 0). This formula places a1next to any outlier and a0next to any normal value. - Apply a simple conditional formatting rule to your data column (or the helper column itself) to highlight any rows where the helper column contains a
1.
The image below shows this exact setup in action in Google Sheets.
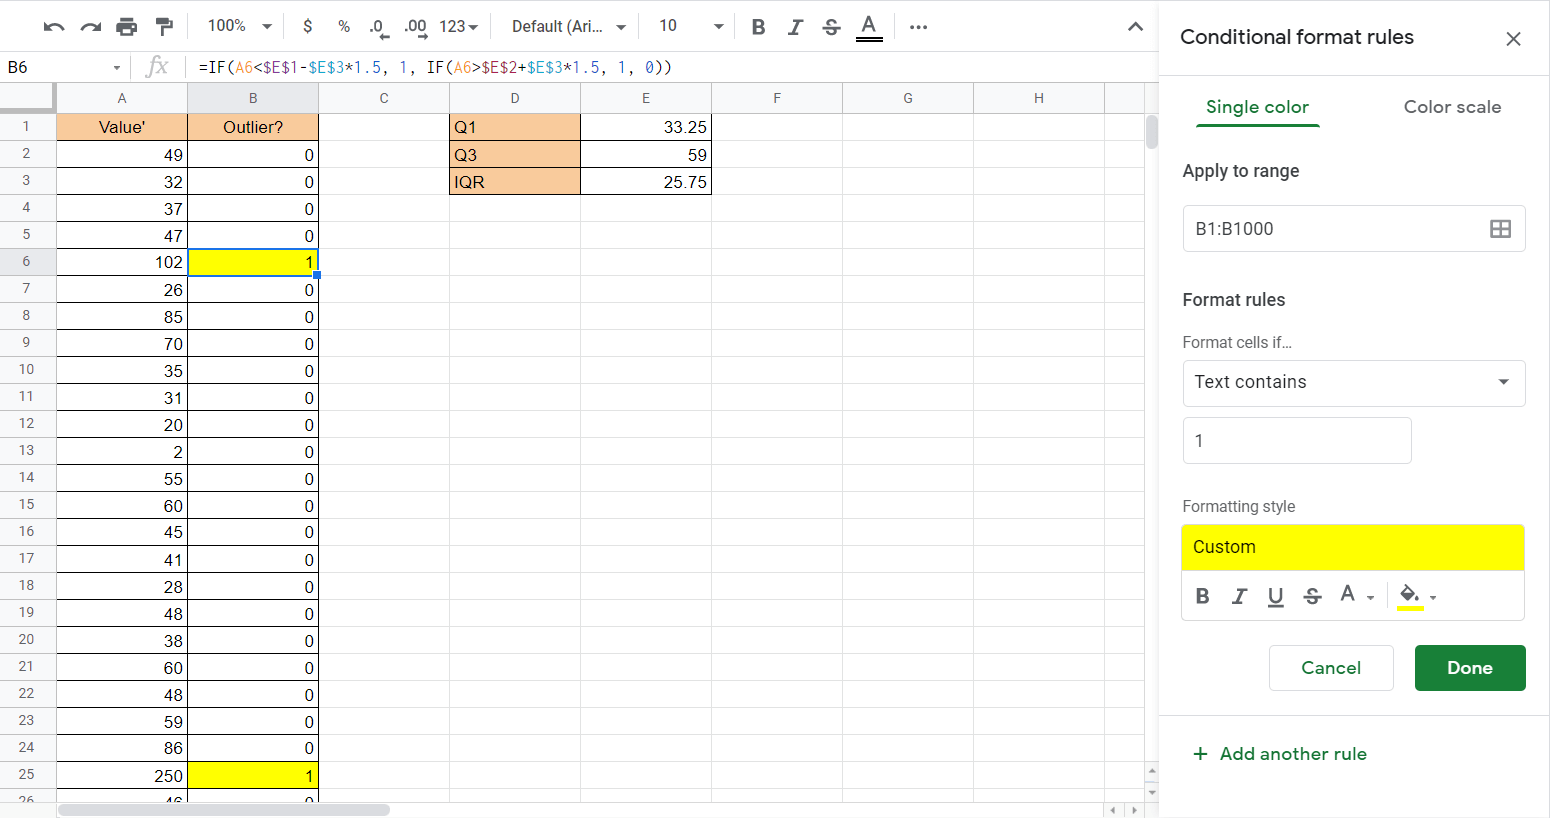
This method is excellent because it not only visually flags outliers but also creates a filterable column, allowing you to easily isolate these data points for further investigation.
5. Hands-On Practice
Let's apply these techniques to the sales data from our previous lesson. Open the practice workbook you used before, or download a fresh copy. We will work with the Amount column in the "Data" sheet.
Practice Problem: Identify Sales Outliers
-
Calculate the Fences:
- In your "Statistics" sheet, find some empty cells. Label and calculate Q1, Q3, and IQR for the
Amountcolumn (Data!D2:D1001). You will need theQUARTILE()function. For Q1, the formula is=QUARTILE(Data!D2:D1001, 1). - Using your calculated Q1 and IQR, create formulas to find the Lower Fence and Upper Fence.
- In your "Statistics" sheet, find some empty cells. Label and calculate Q1, Q3, and IQR for the
-
Identify by Sorting:
- Go to the "Data" sheet. Select the entire data range (A1:F1001).
- Go to Data > Sort range. Sort by the
Amountcolumn in descending order (Z -> A). Look at the top few values. Do they seem unusually high compared to the rest? - Now, sort in ascending order (A -> Z). Do you see any unusually low values?
-
Identify with Conditional Formatting:
- Select the
Amountcolumn (D2:D1001). - Go to Format > Conditional formatting.
- Create a rule to highlight cells that are "not between" your calculated Lower Fence and Upper Fence values.
- Scroll through the data. You should see the extreme values you spotted by sorting are now automatically highlighted.
- Select the
-
(Challenge) Identify with a Helper Column:
- In the "Data" sheet, insert a new column to the right of
Amount. Title it "Is Outlier?". - In cell E2, write an
IF/ORformula that references theAmountin D2 and your calculated fence values. The formula should return "Yes" or "1" if D2 is an outlier, and "No" or "0" if it isn't. Remember to use absolute references (e.g.,$M$1) for your fence values so you can drag the formula down. - Apply the formula to the entire column.
- Now you can easily filter this column to see only the outliers.
- In the "Data" sheet, insert a new column to the right of
Click to see the correct fence calculations
- Q1: $160 (Calculated with
=QUARTILE(Data!D2:D1001, 1)) - Q3: $710 (Calculated with
=QUARTILE(Data!D2:D1001, 3)) - IQR: $550 (Q3 - Q1)
- Lower Fence: -$665 (Calculated with
Q1 - 1.5*IQR) - Upper Fence: $1535 (Calculated with
Q3 + 1.5*IQR)
Based on these fences, any sales amount above $1535 would be considered a high-value outlier. Since sales amounts can't be negative, we don't expect any low-value outliers in this dataset.
Conclusion
In this lesson, you've learned several practical methods for identifying potential outliers, moving from simple visual inspection to a robust, rule-based approach. This is a foundational skill in data cleaning that ensures your subsequent analysis is sound.
Here are the key takeaways:
- Sorting is a quick first-pass method to spot extreme values in smaller datasets.
- The IQR method provides a statistical rule to define outliers by calculating upper and lower fences.
- Conditional Formatting is a powerful tool to automatically highlight data points that fall outside your defined fences, making them easy to spot.
- Using a helper column with an IF/OR formula is an advanced workflow that not only identifies outliers but also makes them easy to filter and analyze as a group.
So far, we've identified outliers by highlighting them within the data table. However, another powerful way to make them stand out is through visualization. In our next lesson, we will explore how to create various charts that can reveal patterns, trends, and outliers in your data at a single glance.