Introduction
In our last lesson, you transformed a basic chart into a clear and professional visualization by adding titles, labels, and annotations. That polished chart is a powerful tool, but it's only one half of the story. A chart shows what happened; your job as a data researcher is to explain why it matters.
This lesson focuses on that crucial final step: writing a concise summary that interprets your visualization and presents key insights to a client. This skill is what separates a data provider from a data analyst. It's how you deliver real value and actionable information, which is exactly what freelance clients are looking for. Instead of just handing over a spreadsheet, you'll be delivering answers.
1. From Description to Insight: The Art of Data Storytelling
The most common mistake beginners make is simply describing the chart. An effective summary goes beyond description to provide insight.
- Description: "Sales were $20,000 in October and $50,000 in November." This is a factual statement that anyone can read from the chart.
- Insight: "Sales surged from $20,000 in October to a yearly high of $50,000 in November, demonstrating the powerful impact of the new holiday marketing campaign. This 150% increase highlights a major opportunity for the next holiday season." This statement explains the significance and suggests implications.
The goal is to build a "data story"—a clear narrative that connects the data points to a meaningful conclusion. It's not about embellishing the facts, but about explaining them in the context of the business question.
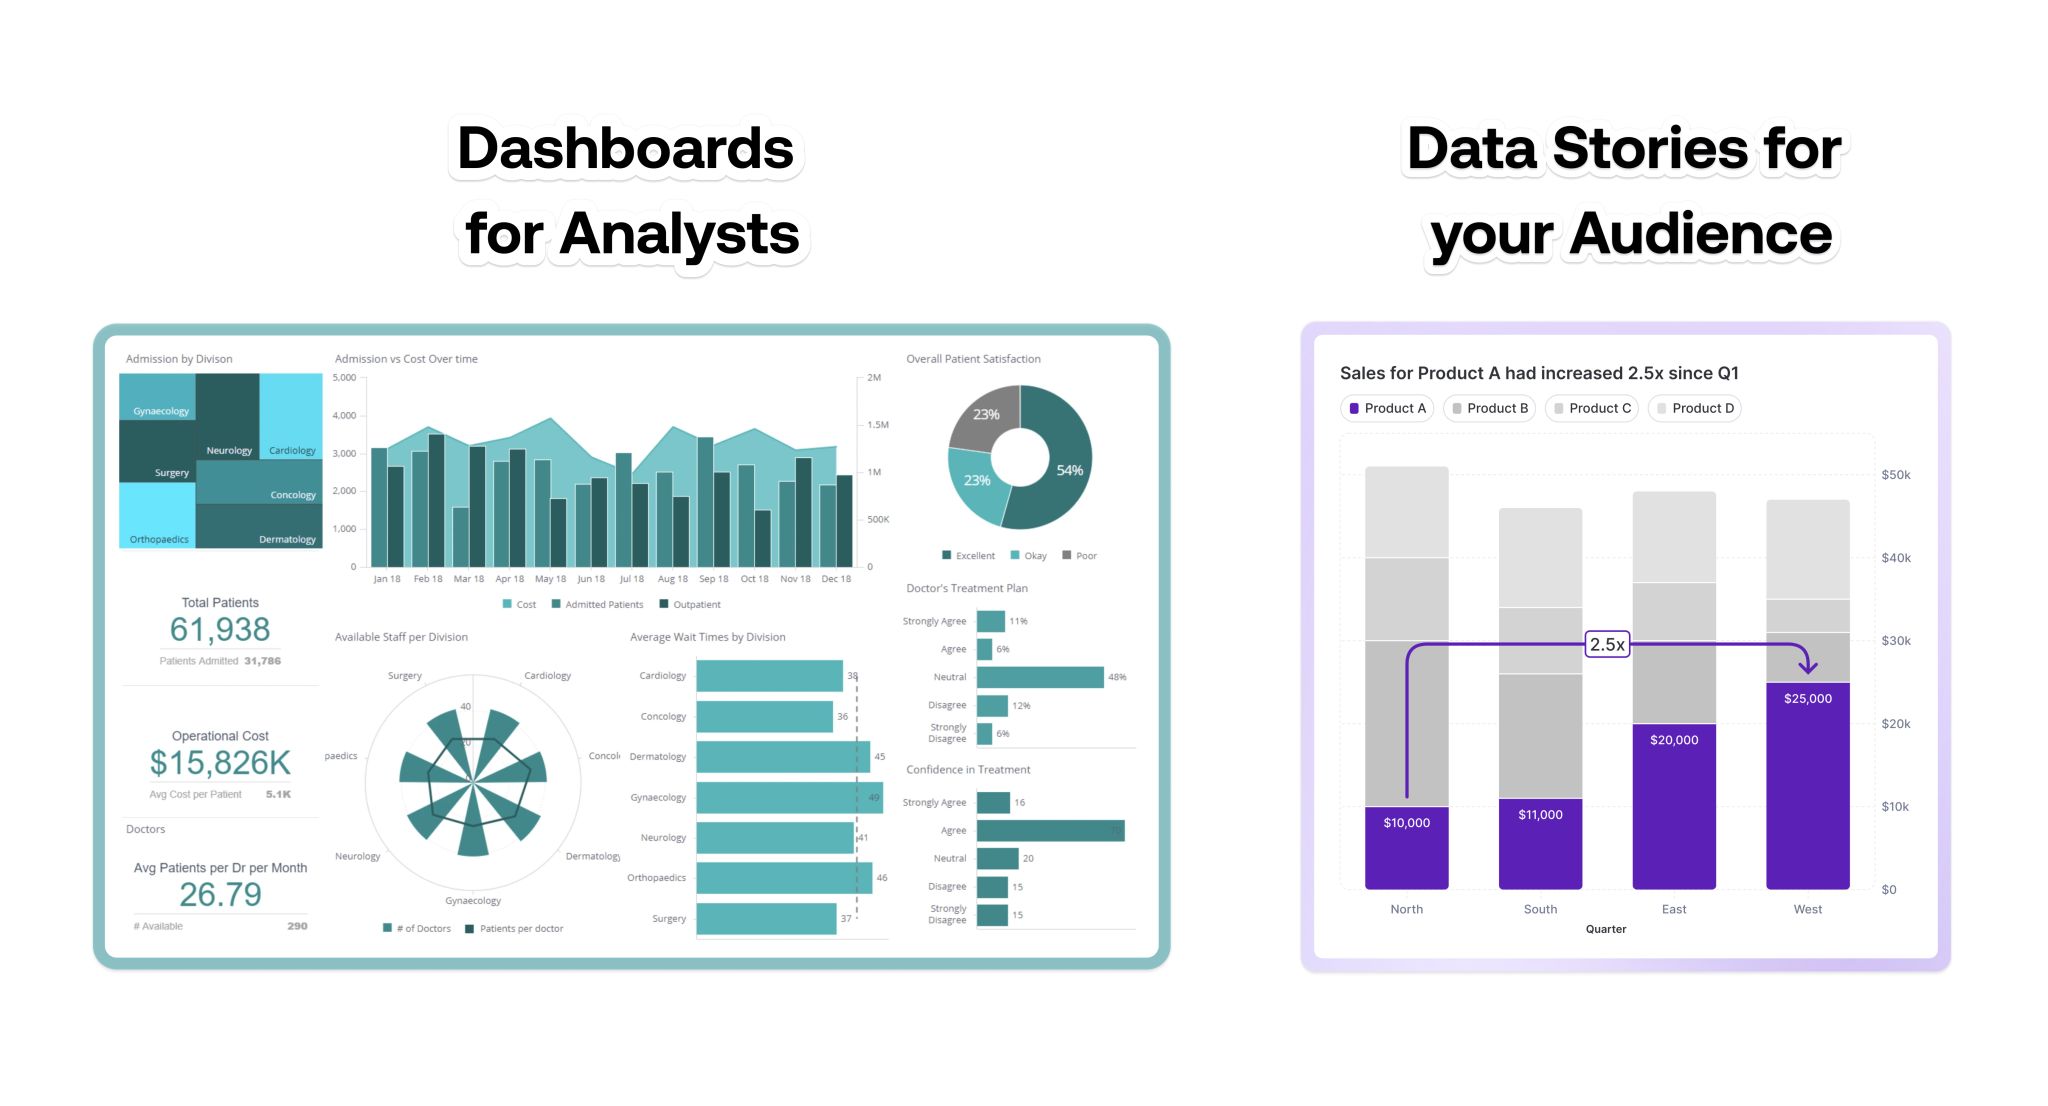
To understand this distinction better, let's hear from a data analytics expert.
Data Storytelling 101 | Think Like a Data Analyst
In this video, "Data Storytelling 101," Christine Jiang clarifies the difference between simply showing data and telling a story with it.
First, watch the introduction where she defines the concept from this section. Notice her example contrasting a simple description ("here's a graph") with a story ("sales dropped... this was driven by... we should look into this"). Next, watch the segment on data storytelling categories from this clip. This will help you think about what kind of story your chart is telling—is it about a trend over time, a comparison between categories, or something else?
2. A Framework for Writing Your Summary
Crafting a data story doesn't have to be complicated. You can follow a simple three-step structure to ensure your summary is concise, insightful, and actionable.
- Start with the Main Takeaway: Lead with the single most important conclusion from your analysis. This is often called the "so what?" of your data.
- Provide Supporting Evidence: Back up your main takeaway with 1-2 specific data points from your chart.
- Offer a Recommendation or Implication: Explain what this insight means for the business or suggest a next step.
This "inverted pyramid" approach, where you start with the conclusion, is especially effective for busy stakeholders who want the key message upfront.
How to Present Data Effectively to Non-Technical Audiences
This article from NUA Training provides excellent advice on structuring your communication for a non-technical audience, which is often the case with freelance clients.
Please read the sections "Start With the Decision, Not the Data" and "Sequence Information With Intention". The core idea is to reverse the typical technical presentation: start with the insight, then provide the evidence.
Now, let's watch a video that puts a similar framework into practice with a concrete example.
Data Analyst on How to Turn Business Metrics to Insights
In "Data Analyst on How to Turn Business Metrics to Insights," Christine Jiang presents a four-pillar framework and then applies it to a real-world scenario.
First, watch her outline the framework from this clip. Her pillars—Asking Questions, Defining, Reporting/Visualizing, and Formulating Recommendations—lead directly to the kind of summary we're building. Then, see how she applies this to a healthcare marketing example from this walkthrough. Pay close attention to how she moves from the chart and table to an insight and then a concrete recommendation about reallocating the budget.
3. Practice: Summarizing Your Sales Chart
It's time to apply this framework yourself. Let's write a summary for the monthly sales trend chart you customized in the previous lesson.
Imagine you are presenting this to a client who owns the business. They don't want a list of numbers; they want to know what the sales trend means for their company.
Let's build the summary step-by-step using our framework.
1. What is the main takeaway?
Look at your line chart. What is the most obvious pattern?
Example Takeaway: "Analysis of the 2023 sales data reveals a significant seasonal peak in the final quarter, which was the primary driver of the year's revenue."
2. What is the supporting evidence?
Mention the specific numbers you highlighted with data labels or annotations.
Example Evidence: "Specifically, sales grew from an average of around [mention the average from earlier months] to a high of [mention the peak value] in [mention the peak month], coinciding with the start of the holiday shopping season."
3. What is the recommendation or implication?
What should the client do with this information?
Example Recommendation: "This pattern strongly suggests that the holiday period is the most critical time for sales. I recommend that next year's marketing budget and inventory planning be heavily focused on capitalizing on this Q4 demand, potentially starting promotional activities as early as October."
Now, combine these three parts into a single, concise paragraph. Open a Google Doc or use the "notes" section in your spreadsheet and write your summary. Your final output should be a short, clear paragraph that any business owner can understand and act upon.
Conclusion
You have now learned to bridge the gap between data and decision-making. A polished chart paired with a concise, insightful summary is a complete analytical product you can deliver with confidence to a freelance client. This demonstrates that you can not only find and organize data but also interpret its meaning.
Here are the key takeaways from today's lesson:
- Go beyond description to provide insight. Don't just state what the chart shows; explain what it means.
- Structure your summary effectively: start with the main takeaway, provide supporting evidence, and finish with a recommendation or implication.
- Always keep your audience in mind. Write for a business owner, not a data scientist. Use clear, direct language.
In our next and final lesson of this module, we will put everything together. You will learn how to structure your chart and its summary into a simple, professional one-page report—a perfect deliverable for many freelance data research projects.