Introduction
In our previous lesson, you crafted a concise, powerful summary that interpreted a sales chart, moving beyond simply describing the data to explaining what it means. You now have the two essential building blocks of a data analysis deliverable: a clear visualization and an insightful interpretation.
This lesson focuses on the final, crucial step: assembling these components into a simple, professional one-page report. For a freelance data researcher, this is often the final product you deliver to a client. It's the tangible result of your work, and presenting it clearly and professionally is key to demonstrating your value. By the end of this lesson, you will have created a complete, client-ready report based on the sales data we've been working with.
1. The Anatomy of an Effective Report
A professional report is more than just a chart and a paragraph pasted into a document. It's a structured communication tool designed to help a busy stakeholder make a decision quickly. Its structure guides the reader from the main point to the supporting details in a logical flow.
Before we build our own, let's look at the essential components of a strong data analysis report.
How to Write a Data Analysis Report (Step-by-Step Guide) - DashThis
This guide from DashThis breaks down the core elements of a data analysis report and emphasizes the importance of understanding your audience.
First, read the section "What is a data analysis report?" to understand the key components, such as the executive summary, clear goals, and practical next steps. Then, focus on the first step. This is the foundation of any good report. For our ongoing sales analysis project, your audience is the business owner, and the purpose is to help them understand yearly sales patterns to plan for the future.
As you can see, a good report is built around a clear purpose. It anticipates the reader's questions and provides answers efficiently. The goal is to create a self-contained document that tells a complete story.
Here is an example of what a professional sales report might look like. Notice how it includes a summary, key metrics, and analysis all in one clean layout.

2. A Simple and Practical Report Structure
For many freelance projects, a complex, multi-page document is unnecessary. A concise one-page report is often more effective. We can use a standardized template to ensure we include all the necessary information in a logical order.
Short research report template | Creative Victoria
This template from Creative Victoria provides a straightforward structure for a research report. We will adapt it for our one-page data analysis deliverable.
Review the entire template. Pay attention to the main headings: Summary, Introduction, Methodology, Results, and Conclusion. For our one-page report, we will combine and simplify these into a more direct format.
Based on these best practices, we will use the following four-part structure for our one-page report:
- Title: A clear, descriptive title.
- Executive Summary: A brief overview of the key finding and recommendation. (This is for the client who only has 30 seconds).
- Findings: The chart itself, paired with the interpretive summary you wrote in the last lesson.
- Conclusion & Recommendations: A clear, bulleted list of actionable next steps.
This structure moves from the most important takeaway to the details, respecting the time of a busy client.
3. Building Your One-Page Report
Now it's time to put everything together. Open a new Google Doc and let's build your report section by section.
Step 1: Title
At the top of the page, give your report a clear and professional title.
Example: 2023 Annual Sales Analysis Report
Step 2: Executive Summary
This is the most important part of your report. As we learned in the DashThis article, it's often best to write this last, but for our structure, we'll place it at the top. It should concisely state the main problem, the single most important finding, and your primary recommendation.
Example:
This report analyzes the total sales for 2023 to identify key trends and inform future marketing strategy. The analysis reveals a significant seasonal sales peak in Q4, driven by the holiday season. It is recommended to allocate additional marketing and inventory resources to capitalize on this trend in the upcoming year.
Step 3: Findings
This section presents the evidence.
- Insert your chart: Copy the final, polished line chart of the 2023 sales data from your Google Sheet and paste it into your document.
- Add your interpretation: Below the chart, paste the interpretive summary you wrote in the previous lesson. This paragraph explains the "so what" of the chart.
Example:
(Your customized line chart would go here)
Analysis of the 2023 sales data reveals a significant seasonal peak in the final quarter, which was the primary driver of the year's revenue. Specifically, sales grew from an average of around $18,000 in the first three quarters to a high of over $50,000 in November, coinciding with the start of the holiday shopping season. This pattern strongly suggests that the holiday period is the most critical time for sales.
Step 4: Conclusion & Recommendations
This final section makes your advice explicit and actionable. It should be a direct, clear list of what the client should do next based on your findings.
Example:
The data clearly indicates that Q4 is the most significant period for revenue generation. To leverage this opportunity, the following actions are recommended:
- Marketing: Begin holiday marketing campaigns in early October to build momentum leading into the November peak.
- Inventory: Ensure inventory levels for top-selling products are at their highest from October to December.
- Staffing: Plan for increased staffing in sales and customer support during Q4 to handle the higher demand.
The final report should be clean, easy to read, and contained on a single page. Remember the advice on clarity from the "Data Storytelling 101" video you watched.
Data Storytelling 101 | Think Like a Data Analyst
This video on data storytelling offers excellent advice on keeping your visuals and reporting clear and effective.
Watch the segment on industry best practices from this clip. The key ideas to apply to your report are: Clarity over "cool": A simple, clean report is better than a flashy one that is hard to read. Story-driven titles: Your section headers should help tell the story. Data-to-ink ratio: Remove anything that doesn't add value (extra borders, unnecessary colors, etc.).
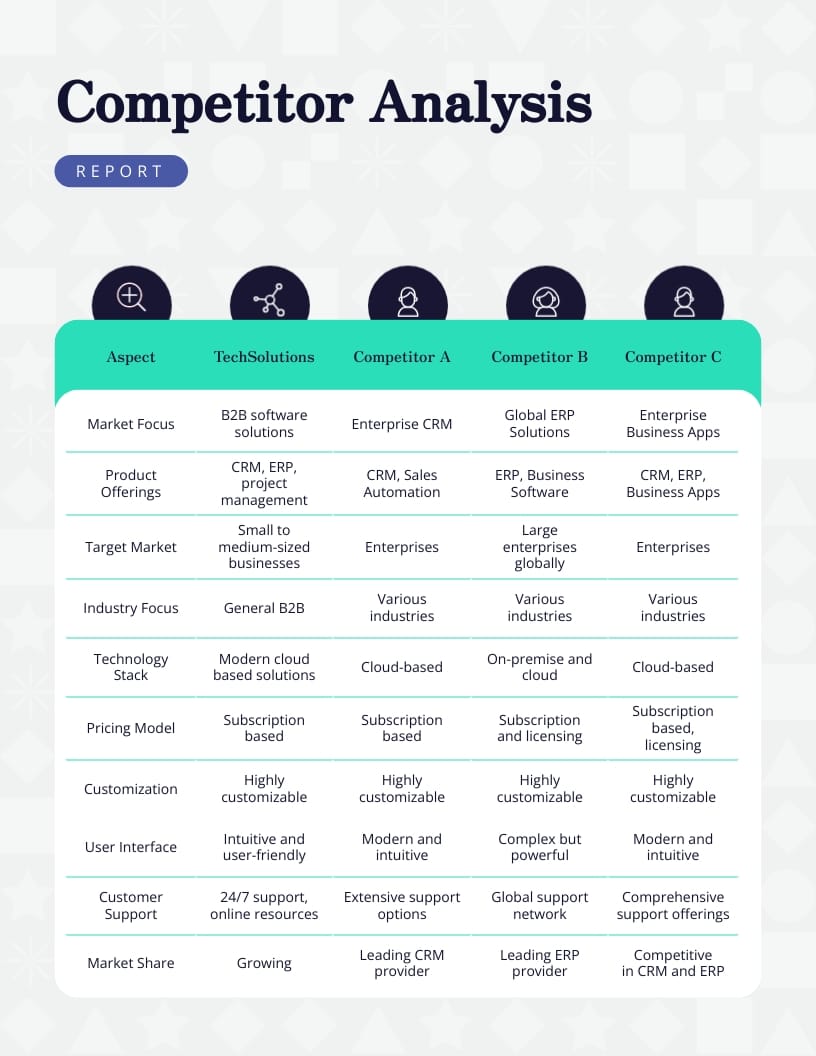
While our example uses a chart, remember that findings can also be presented in other formats, like the competitor analysis table shown below. This is a format you will use later in the course.
Conclusion
Congratulations! You have now created a complete, professional one-page data analysis report. This is a fundamental and highly valuable deliverable in freelance data research. By structuring your findings clearly, you empower your clients to make informed decisions based on the data you've provided.
Let's summarize the key takeaways:
- A professional report has a clear structure: Title, Executive Summary, Findings, and Recommendations.
- Always define your audience and purpose before you start writing to ensure your report is relevant and impactful.
- Structure your report like an inverted pyramid, starting with the most important conclusion in the Executive Summary.
- Keep the design clean and simple, prioritizing clarity over flashy visuals.
You have now completed the "Data Analysis and Reporting" module. You've learned to summarize data, create visualizations, interpret findings, and present them professionally.
In our next module, we will begin your first hands-on project: Lead Generation. You will apply the research and spreadsheet skills you've developed to build a real-world client deliverable from scratch.