Introduction
In our last lesson, you transformed your raw research into a structured analysis, creating a competitor comparison matrix, conducting a SWOT analysis, and drafting a summary report. You now have all the components of a solid market analysis. This final lesson in our project will focus on elevating that draft into a polished, professional deliverable for your client, GreenLeaf Organics.
Today, we'll focus on two key elements that separate a good report from a great one: compelling data visualizations and truly actionable recommendations. You will learn to create charts that tell a story at a glance and refine your suggestions into a clear, data-driven strategy. By the end of this lesson, you will have a complete, client-ready report that showcases the full value of your research.
Part 1: Bringing Your Data to Life with Visualizations
Numbers and tables are essential, but for a busy client, a well-designed chart is often the quickest way to understand a key finding. Visualizations turn data into an immediate, intuitive story. Your goal is not to create complex dashboards, but to select one or two key data points and present them visually to support your main arguments.

We will now create a simple but effective chart in your Google Sheet to compare the prices of the competing Vitamin C serums.
Interactive dashboards in Google sheets
This video from David Benaim provides a great walkthrough of creating and customizing charts in Google Sheets. We'll focus on the basics of chart creation and clean-up.
First, watch the section on creating basic charts from your data. The presenter demonstrates how to select two columns and generate a chart. Then, watch the segment on customizing charts to see how to remove unnecessary clutter like axis titles and gridlines to make your visual clearer.
Your Task: Create a Price Comparison Chart
- Open your
GreenLeaf Organics - Competitor DataGoogle Sheet and go to the Comparison Matrix tab. - Select the data for your chart. Click the cell with the first competitor's name, then hold down the
Ctrlkey (orCmdon Mac) and select the corresponding cell in thePricerow. Continue holdingCtrl/Cmdto select the names and prices for all competitors. - With the data selected, go to Insert > Chart. Google Sheets will likely suggest a chart type; a Bar chart or Column chart is ideal for this comparison.
- Use the Chart editor on the right to customize your chart:
- Under the Customize tab, go to Chart & axis titles. Give your chart a clear title, like "Competitor Price Comparison (30ml Serum)".
- To make it cleaner, you can remove the horizontal axis title (the one that says "Price") since the context is clear.
- As shown in the video, you can go to Gridlines and ticks and uncheck "Major gridlines" to give the chart a cleaner look.
- Your chart is now ready. It provides an instant visual answer to the question, "How do competitor prices stack up?"
Part 2: From Recommendations to Actionable Strategy
In your draft report, you listed some initial recommendations. Now, we'll refine them to be "actionable." An actionable recommendation is not just a suggestion; it's a clear, specific, and justified next step that a client can immediately act upon. It answers the question, "So what should we do now?"
To develop these, we need to move from data (what happened) to insight (why it happened and what it means). The following resources provide an excellent framework for this kind of strategic thinking.
How to Write Effective Insights from Data Analysis | NareshIT
This article from NareshIT clearly explains the crucial difference between simply reporting data and deriving true, actionable insights.
Read the sections "What Are Data Insights?" and "The Difference Between Data, Information, and Insight" to understand this key concept. Then, review the first three steps of the guide, which introduce the powerful "Observation → Explanation → Recommendation" framework.
Now let's look at how to structure these actionable recommendations within your report.
How to Write a Data Analysis Report (Step-by-Step Guide) - DashThis
This guide from DashThis offers a practical, step-by-step process for building a data report that drives decisions. We'll focus on the section that turns analysis into action.
Please read the sections "Analyze and interpret your data" and focus especially on the framework described under the headings "Why did this change?" and "What will we do?". Notice how it concludes with specific actions and a measurable goal.
Your Task: Refine Your Recommendations
-
Open your
GreenLeaf Organics - Summary ReportGoogle Doc. -
Go to the Recommendations section you drafted in the last lesson.
-
Using the principles from the articles, rewrite each recommendation to be more specific, data-driven, and actionable.
-
Weak Recommendation: "Proceed with launching a 50ml product size."
-
Actionable Recommendation: "Launch a 50ml 'Value Size' serum to fill a clear market gap, as all current competitors only offer 30ml bottles. This directly addresses customer complaints about high costs found in Competitor B's reviews and positions GreenLeaf as a more economical premium choice."
-
Weak Recommendation: "Emphasize 'certified organic' in marketing."
-
Actionable Recommendation: "Focus marketing messaging on 'certified organic ingredients' and transparent sourcing. This will create a distinct niche against the broader 'clean beauty' trend (identified via Google Trends) and appeal to customers who, according to reviews, value ingredient transparency."
-
Part 3: Assembling Your Final, Professional Report
You now have all the pieces: refined text and a compelling visual. The final step is to assemble them into a single, professional document. For freelance projects, a concise, well-structured one-page report is often the most impactful format.
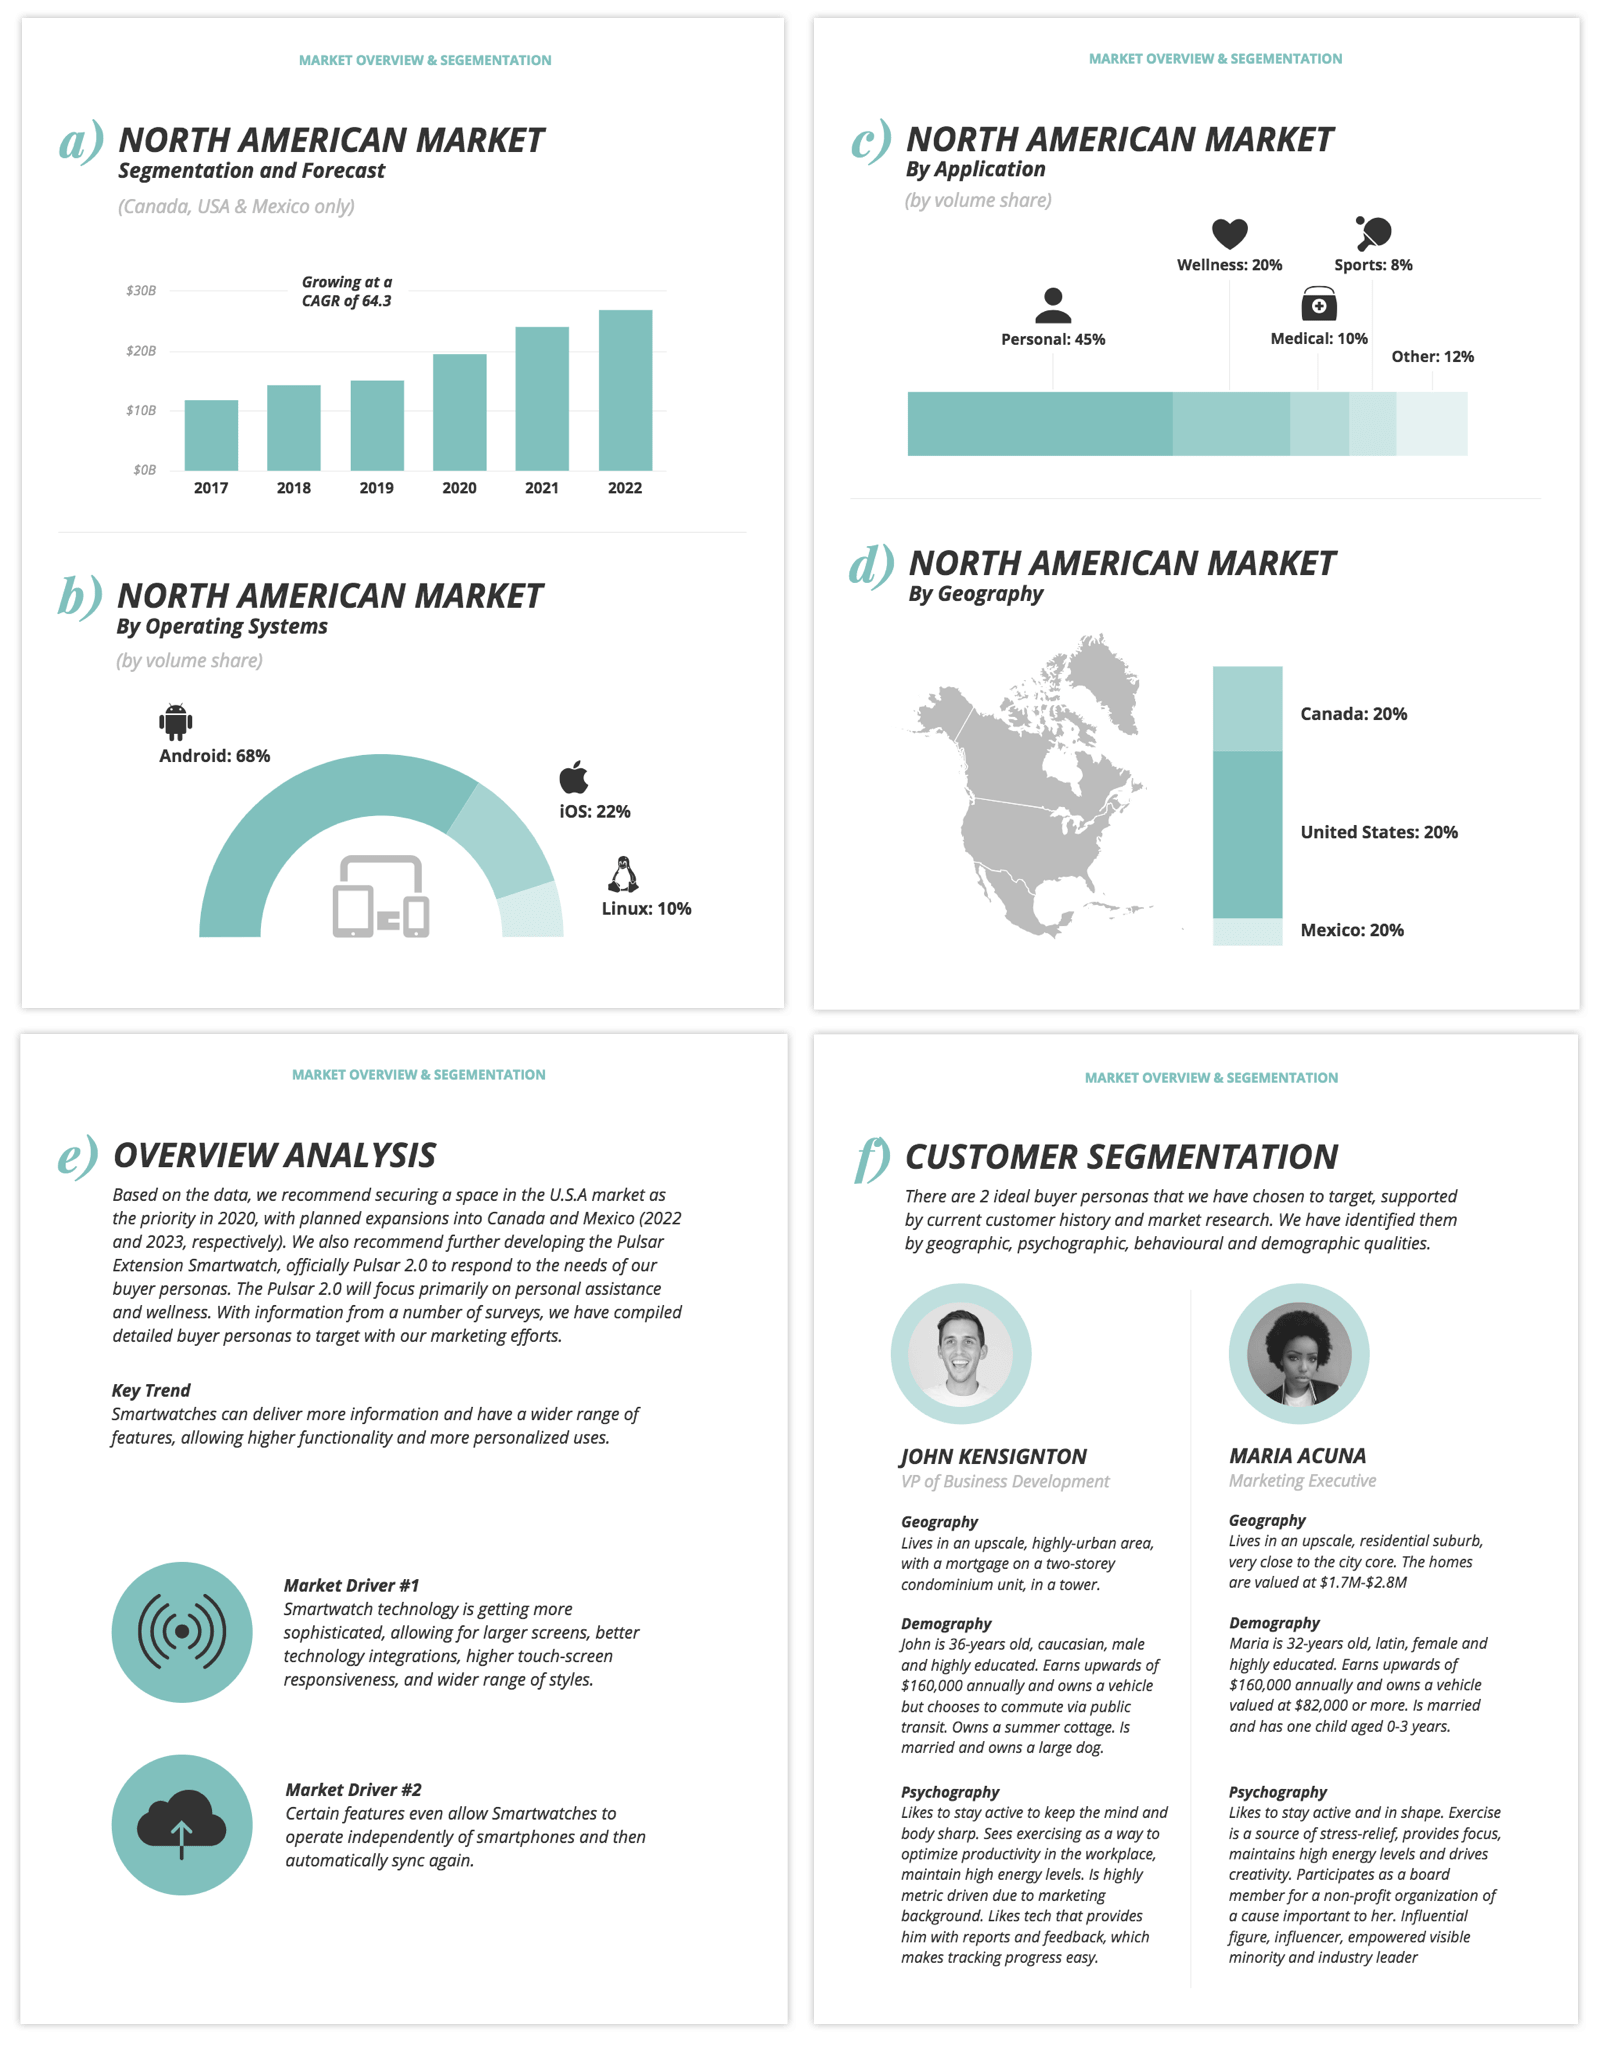
Your Task: Finalize and Polish Your Report
-
Insert Your Chart:
- In your
GreenLeaf Organics - Competitor DataGoogle Sheet, click on the price comparison chart you created. - Click the three dots in the top-right corner of the chart and select Copy chart.
- Go to your
GreenLeaf Organics - Summary ReportGoogle Doc. Place your cursor where you'd like the chart to appear (e.g., under the Key Findings) and pressCtrl+V(orCmd+V) to paste it. When prompted, choose to "Link to spreadsheet". This way, if you ever update the data, the chart in your report can be updated with one click.
- In your
-
Write the Executive Summary:
The first section of a report is often called an "Executive Summary." It's a high-level overview of the entire document, written for a busy executive who might only read that one section. As a best practice, you should write it last.- In your Google Doc, add a new heading at the very top: Executive Summary.
- Under this heading, write 3-4 sentences that summarize the entire project: the initial goal, the single most important finding, and your top recommendation.
- Example: "This report analyzes the competitive landscape for Vitamin C serums to guide the launch of GreenLeaf Organics' new product. The analysis reveals a market dominated by small, 30ml products with mixed customer feedback on value. We recommend launching a larger, 50ml 'value size' serum to immediately differentiate GreenLeaf and capture a clear market opportunity for a premium, economical option."
-
Review and Format:
- Read through your entire report one last time. Check for typos and ensure the language is clear and professional.
- Adjust formatting for readability. Use bolding for headings, and ensure there is enough white space around your text and chart. The goal is a clean, scannable, and professional-looking document.
Conclusion
Congratulations on completing your first market analysis project! You've gone from a client brief to a final, professional report. This process—planning, researching, synthesizing, and presenting—is the core of what a data researcher does.
Here are your key takeaways from this lesson:
- Visuals Amplify Insights: A simple chart can communicate a key finding more effectively than a table of numbers.
- Actionable Recommendations Drive Value: The most valuable insights are those that lead to specific, data-justified actions.
- Professional Presentation Matters: A well-structured, clean, and concise report demonstrates your professionalism and makes your findings easy for a client to digest.
You now have a tangible project you can be proud of. In our next module, we will shift focus to the business side of freelancing. You'll learn how to take the skills and project work you've just completed and use them to build a freelance profile, find clients, and start your career as a data researcher.