Introduction
In our last lesson, you did the essential fieldwork for our GreenLeaf Organics project, systematically gathering competitor data into your spreadsheet and analyzing broader market interest with Google Trends. You've successfully moved from planning to execution, and now you have the raw materials for your analysis.
This lesson focuses on synthesis—the critical step where you transform that raw data into a coherent story with actionable insights for your client. This is often the most valuable part of a data researcher's work. We will organize your findings into a clear competitor comparison matrix and then use that to build a concise summary report. By the end of this lesson, you will have a nearly complete analysis ready for final presentation.
From Data to Insights
So far, you have a spreadsheet filled with facts about different products. On its own, this data isn't very useful to a client. They don't just want to know what the competition is doing; they want to know what it means for them. Your job is to connect the dots and tell a story that leads to a smart business decision.
We will create two key documents to tell this story:
- A Comparison Matrix: A table in your spreadsheet that places all competitors side-by-side for easy visual comparison.
- A Summary Report: A short document that outlines the key findings, opportunities, and your recommendations for GreenLeaf Organics.
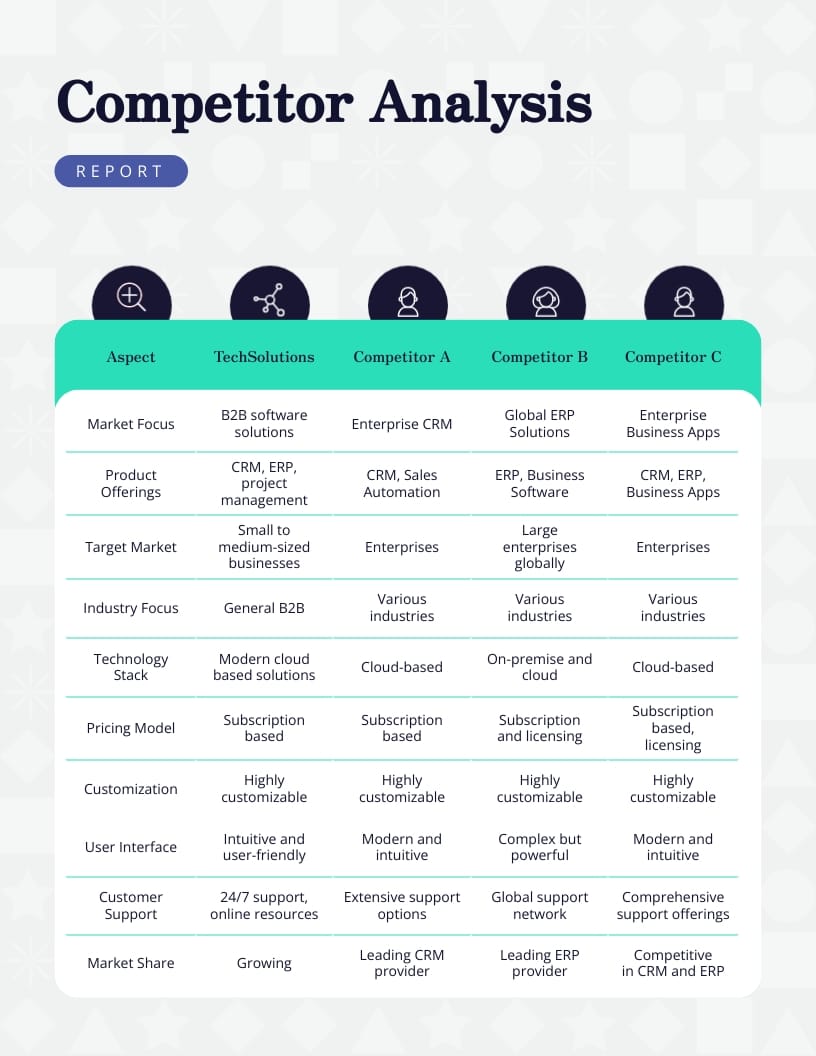
A well-structured analysis can be presented in many formats. The image below shows a professionally designed example. While we will be working in a spreadsheet, the principle is the same: to present a clear, at-a-glance overview of the competitive landscape.
Building Your Competitor Comparison Matrix
The first step in synthesis is to organize your data. Instead of flipping between different tabs for each competitor, we'll create a master view. This matrix will help you—and your client—spot patterns instantly.
For this project, a feature comparison matrix is the most effective format. It's simple, visual, and directly compares products on the attributes that matter most to customers. The following article provides an excellent guide to creating one.
How to Create a Competitive Matrix (Guide + Templates)
This guide from Crayon demonstrates how to build different kinds of competitive matrices. We will focus on the most practical one for our needs.
Please read the section on the Feature comparison matrix. Notice how it uses a simple table structure and color-coding to convey information quickly. We'll adopt this approach to structure the data you've already collected.
Your Task: Create the Matrix
Now it's time to build your own matrix.
- Open your
GreenLeaf Organics - Competitor DataGoogle Sheet. - Create a new tab and name it Comparison Matrix.
- Set up the matrix structure:
- In Column A, list the attributes you researched. These will be your rows:
Price,Size,Key Ingredients,Value Proposition,Social Media Content Theme,Key Praise from Reviews,Key Complaints from Reviews. - In Row 1, list your competitors in the columns, starting from Column B (e.g.,
Competitor A,Competitor B,Competitor C).
- In Column A, list the attributes you researched. These will be your rows:
- Go through your individual competitor tabs and copy the summarized information into the appropriate cells of your new matrix. The goal is to have concise summaries, not long paragraphs.
- Bonus: Apply simple color-coding to the cells to add a visual layer of analysis. For instance, for the 'Price' row, you could color the cell with the lowest price green and the highest price red.
When you're done, you'll have a powerful one-page overview of the competitive situation.
Using SWOT to Find the Story
With your data neatly organized in the matrix, patterns should start to emerge. A SWOT analysis is a simple but powerful framework used to structure these observations. SWOT stands for:
- Strengths: What are the competitors doing well?
- Weaknesses: Where are their vulnerabilities? What are customers complaining about?
- Opportunities: What gaps exist in the market that your client could fill?
- Threats: What external factors could pose a challenge to your client?
The SWOT analysis is the bridge between your data and your final recommendations.
7 Easy Steps on How to Perform a Competitor Analysis
This video from LYFE Marketing provides a quick overview of the competitor analysis process, concluding with the SWOT analysis as the key synthesis step.
Watch this short segment on the SWOT analysis to see how it's used to pull all your research together and inform a plan.
The SWOT framework is a core part of building a final report. The following resource shows how it fits into the overall process of creating a report from start to finish.
How to Create a Competitive Analysis Report in 5 Steps - Socialinsider
This article from Socialinsider provides a complete workflow for creating a competitive analysis report. We'll focus on the final steps that involve making sense of the data.
Read through the main steps of the process described in the article. Pay close attention to Step 4: Run a SWOT analysis and Step 5: Compile actionable insights and recommendations. This demonstrates how the SWOT framework is not just an exercise, but the direct source for the valuable recommendations you'll provide to your client.
Your Task: Perform a SWOT Analysis
-
In your
GreenLeaf Organics - Competitor Dataspreadsheet, create another new tab and name it SWOT Analysis. -
Set up four sections: Strengths, Weaknesses, Opportunities, and Threats.
-
Looking at your Comparison Matrix and the Google Trends data from the last lesson, fill in 2-4 bullet points for each section. Think critically about what the data is telling you.
- Example Strength: "Competitor A has the lowest price point, making it highly attractive to budget-conscious buyers."
- Example Weakness: "Customers frequently complain about Competitor B's packaging, stating that the dropper leaks."
- Example Opportunity: "None of the competitors offer a bottle size larger than 30ml. There is a potential gap for a larger, more economical option."
- Example Threat: "The Google Trends data shows that consumer interest in 'clean beauty' is growing faster than 'organic skincare,' which could make GreenLeaf's positioning more challenging."
This exercise forces you to move beyond simply listing facts and start forming strategic conclusions.
Drafting the Summary Report
The final step is to bring your conclusions together into a concise, easy-to-read summary report. For many freelance projects, a simple one-page document is far more effective than a lengthy presentation. Your goal is to be clear, direct, and focused on what the client should do next.
Your Task: Write the Summary Report
-
Create a new Google Doc and title it
GreenLeaf Organics - Summary Report. -
Structure your report using the following simple headings. This format is inspired by the "Executive summary template" in the Socialinsider article.
Project Objective:
(Briefly restate the goal of the research. You can take this from the research plan you created in the first lesson of this project.)Key Findings:
(Write 3-5 bullet points summarizing your most important discoveries from the research. These should be your 'aha!' moments.)- Example: "While Competitor A leads on price, it suffers from significant negative customer feedback regarding service and packaging quality."
- Example: "The market shows strong, growing interest in 'clean beauty,' which presents both an opportunity and a challenge to the 'organic' positioning."
Identified Opportunities:
(This is the most important section for your client. List 2-3 clear opportunities you uncovered from your SWOT analysis.)- Example: "There is a clear market gap for a premium, larger-sized (e.g., 50ml) Vitamin C serum, as all current competitors focus on smaller, 30ml bottles."
- Example: "Customer reviews indicate a desire for more transparent ingredient sourcing, which aligns perfectly with GreenLeaf's brand ethos."
Recommendations:
(Based on the opportunities, suggest 1-2 concrete, actionable next steps for GreenLeaf Organics.)- Example: "Proceed with launching a 50ml product size to immediately differentiate from the competition."
- Example: "Emphasize the 'certified organic' aspect in marketing campaigns to carve out a distinct niche against the broader 'clean beauty' trend."
This document is the culmination of your research. It's where your hard work pays off by delivering real, tangible value to your client.
Conclusion
In this lesson, you took a crucial step from data collector to data analyst. You learned how to synthesize raw information into a structured, insightful narrative that can guide business decisions.
Here are your key takeaways:
- Synthesis Creates Value: Transforming raw data into a clear story with actionable insights is the most critical part of data research.
- The Comparison Matrix Visualizes Data: Placing competitors side-by-side in a matrix makes it easy to spot patterns and differences.
- SWOT Provides Structure: The SWOT framework is a simple yet powerful tool for organizing your observations into strategic insights.
- The Summary Report Delivers the Message: A concise report focused on findings, opportunities, and recommendations is the most effective way to communicate your value to a client.
You now have a complete analysis in hand. In the final lesson of this project, we will focus on polishing and presenting your work. You'll learn how to refine your report, create simple charts to support your findings, and package everything into a professional final deliverable.