Introduction
Welcome to the final lesson in our Market Research module. Over the past several lessons, you have learned how to gather critical intelligence on competitors by analyzing their websites, social media, customer reviews, and pricing strategies. You now have a collection of valuable but separate pieces of data. For a client, raw data isn't enough; they need to understand what it all means. This lesson is about bringing everything together.
Our goal is to learn how to build a competitor comparison matrix. This is a powerful tool that synthesizes all your research findings into a single, easy-to-digest format. As a freelance data researcher, mastering the creation of these matrices will allow you to deliver clear, actionable insights, elevating the quality and value of your work. We will focus on building a practical matrix in Google Sheets, turning the data you've learned to collect into a compelling story.
1. What is a Competitor Comparison Matrix?
At its core, a competitive matrix is a chart or table that organizes your research to compare your client's business against its competitors on a set of key criteria. It transforms lists of data points into a visual snapshot of the competitive landscape.
Let's start by looking at a couple of common examples.
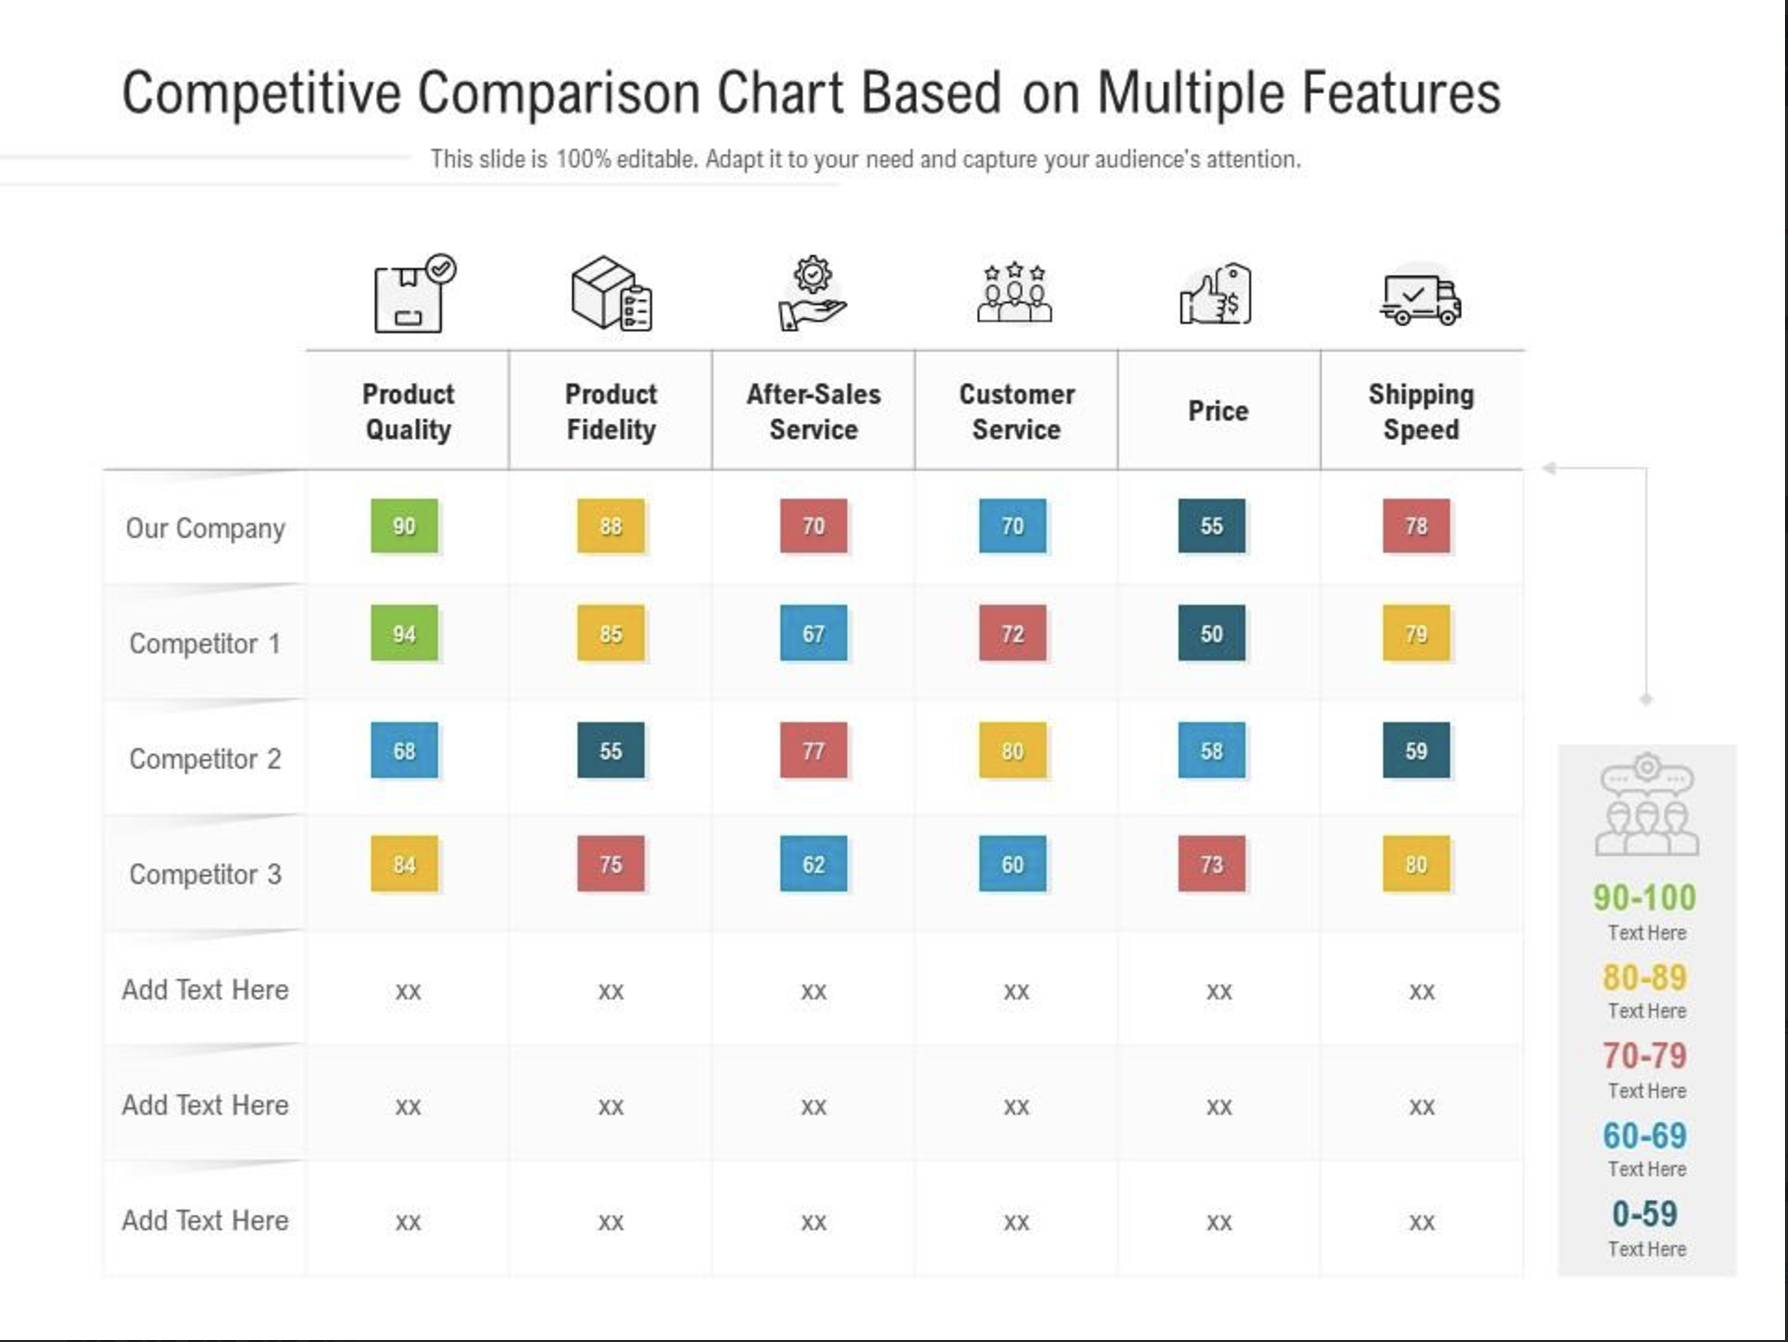

As you can see, these matrices make it easy to spot strengths and weaknesses at a glance. But why is this so valuable? The following video from LYFE Marketing explains the strategic importance of competitor analysis.
7 Easy Steps on How to Perform a Competitor Analysis
This video, "7 Easy Steps on How to Perform a Competitor Analysis," provides a great overview of the "why" behind this work.
Watch the segment from the beginning until 02:12. Pay close attention to the reasons given for performing an analysis, such as: Identifying what competitors are doing correctly (and incorrectly). Finding gaps in the market. Establishing your client's unique value proposition.
The competitor matrix is the primary tool for achieving these goals. It's the deliverable that presents your findings in a way that helps business owners make strategic decisions.
2. Types of Matrices and Choosing Your Factors
There isn't one single way to build a matrix. The format and the factors you choose to compare will depend on your client's specific goals. The Pipedrive blog offers a great guide to the different formats you might encounter.
The Beginner's Guide to the Competitive Matrix
This article from Pipedrive provides clear definitions and examples of common matrix types.
First, read the introduction to solidify your understanding. Then, review the section titled "What are the different competitive matrix types?". As you read, notice how each type serves a different purpose: SWOT Analysis: Focuses on Strengths, Weaknesses, Opportunities, and Threats. Competitive Positioning Grid: Often a scatter plot that maps two key variables, like price vs. quality. Competitive Comparison Chart: A table format for comparing multiple features, which is what we will focus on building.
The factors you choose to include are the most important part of the process. These should directly relate to the data you have collected in our previous lessons:
- Price: Data gathered via
IMPORTXMLor manual research. - Product Features: Information from competitor websites.
- Customer Service: Insights from analyzing customer reviews.
- Social Media Engagement: Follower counts and post frequency.
- Shipping Speed / Return Policy: Details from their sales process.
For today's practical exercise, we will build a Competitive Comparison Chart, as it's the most flexible and commonly used format for freelance projects.
3. Hands-On: Building Your Comparison Matrix in Google Sheets
Let's create a matrix that synthesizes data about product features. This is a classic deliverable that a client could use to inform product development or marketing messaging. We will build a simple, color-coded table, inspired by the "feature comparison" example in an article by Crayon.
How to Create a Competitive Matrix (Guide + Templates)
This guide from Crayon provides step-by-step instructions for creating different matrices. We'll focus on the most straightforward one.
Please read the section on feature comparison. Note the simple structure: competitors in columns, features in rows, and colors to indicate performance (strong, weak, absent). This is the model for our exercise.
Now, let's build it.
Step 1: Set Up Your Spreadsheet
- Open a new Google Sheet.
- In cell
A1, type "Feature". - Starting in cell
B1,C1, andD1, enter the names of three competitors. You can use hypothetical companies or real ones from a product category you're familiar with. - In cell
E1, enter "Your Client's Company". - Starting in cell
A2and going down, list 5-7 key features relevant to the product category. For example, if you're analyzing smartphones, features might include "Screen Size," "Camera Quality," "Battery Life," "5G Connectivity," etc.
Your sheet should look something like this:
| Feature | Competitor A | Competitor B | Competitor C | Your Client's Company |
|---|---|---|---|---|
| Screen Size | ||||
| Camera Quality | ||||
| Battery Life |
Step 2: Populate and Score the Data
Fill in the matrix based on your (hypothetical) research. For simplicity, we'll use a basic scoring system:
2for "Strong" (feature is a key strength)1for "Weak" (feature exists but is not competitive)0for "Absent" (feature is not offered)
Step 3: Add Conditional Formatting
To make the matrix easy to read, apply conditional formatting (which you learned in Module 1).
- Select the entire data range (e.g.,
B2:E8). - Go to
Format > Conditional formatting. - Create three rules for the range:
- If
Cell value is equal to2, make the cell background green. - If
Cell value is equal to1, make the cell background yellow. - If
Cell value is equal to0, make the cell background red.
- If
Your matrix now provides a powerful visual summary.
Step 4: Add a Summary Score
To quickly determine an overall winner, we can add a total score for each competitor. This is a great way to add value for your client. The following video demonstrates a clever way to count up scores in Excel, and the same principle applies directly to Google Sheets.
How to make a Product Comparison Template in Excel (Benchmarking)
This video, "How to make a Product Comparison Template in Excel," shows how to create a summary score to rank competitors.
Watch the section from 05:29 to 07:14. The presenter uses the COUNTIF function to count the number of "ticks." We can adapt this idea using the SUM function with our scoring system.
In your Google Sheet, create a new row called "Total Score". In the cell for Competitor A's score, enter the formula =SUM(B2:B8), assuming your features are in rows 2 through 8. Drag this formula across for the other competitors and your client's company. You now have a simple, quantitative ranking that instantly shows who is leading on features.
Conclusion
You have successfully built a competitor comparison matrix, a cornerstone deliverable for market research. This process takes disparate data points and synthesizes them into a strategic tool that is clear, insightful, and actionable for a client. This is a skill that directly translates to paid freelance work.
Here are the key takeaways from today's lesson:
- Synthesis is Key: A matrix turns raw research into a coherent story about the competitive landscape.
- Form Follows Function: The type of matrix you build (e.g., table, scatter plot) should match your client's goals. A feature comparison chart is a versatile and valuable format.
- Google Sheets is Your Tool: You can build professional-looking and effective matrices using basic spreadsheet functions, conditional formatting, and simple formulas like
SUM. - From Data to Decisions: The ultimate goal of a matrix is to help businesses identify gaps, spot opportunities, and make informed strategic decisions.
In our previous lessons, we focused on collecting and organizing data. With the creation of this matrix, you've taken the first major step into analysis and reporting. In our next module, "Data Analysis and Reporting," we will dive deeper into quantitative analysis, starting with how to use pivot tables to summarize large datasets.