Introduction
Welcome back! In our previous lesson, we established the conceptual foundation of linear regression. We defined the model as a linear hypothesis function and explored the critical assumptions—like linearity and homoscedasticity—that must hold for the model to be reliable. You now understand what a linear model is and the "rules" it should follow.
However, a crucial question remains unanswered: given a set of data, how do we find the best possible line? What does "best" even mean in a mathematical sense? This lesson directly addresses that question by focusing on the learning outcome: Derive the cost function (Mean Squared Error) for linear regression.
We will construct, from first principles, a function that precisely measures the error of our model. This "cost function" is the cornerstone of training not just linear regression, but a vast number of machine learning algorithms. Mastering this concept is a vital step toward understanding how machines learn.
1. The Need for a "Cost" Metric
Imagine you have a scatter plot of data points. You can draw an infinite number of straight lines through that data. Our goal is to find the single line that best represents the underlying trend. To do this objectively, we need a way to score each potential line—a metric that tells us how "wrong" it is. This score is what we call the cost or loss.
A lower cost means a better fit. The line with the lowest possible cost is our "best-fit line."
Let's begin by reading a short article that introduces this core idea and sets the stage for building our own cost function.
The Cost Function of Linear Regression: Deep Learning for Beginners
This article, 'The Cost Function of Linear Regression' from Built In, provides an excellent high-level introduction to why we need a cost function and its role in measuring model performance.
Please read the introductory section titled 'What Is Cost Function of Linear Regression?'. Focus on how the cost function quantifies the error between predicted and expected values into a single number.
2. Deriving the Cost Function from First Principles
Now, let's derive this cost function step-by-step. Our goal is to create a single number that represents the total error of our model across all data points.
Step 1: The Error for a Single Data Point
For any single data point, the error is simply the difference between the value our model predicts and the actual value. This vertical distance is often called the residual.
- Actual value:
- Predicted value:
- Error (residual):
Our first instinct might be to sum up these errors for all points in our training set. However, there's a problem with this approach.
Step 2: The Flaw in Summing Raw Errors
What happens if our model predicts a value that is too high for one point (a positive error) and a value that is too low for another (a negative error)? If we simply add them, they might cancel each other out, giving us a deceptively small total error.
To understand this problem and see how we can fix it, let's continue with the article from Built In.
The Cost Function of Linear Regression: Deep Learning for Beginners
The following sections of the article walk through the logical process of building a robust cost function. It first demonstrates the problem with summing raw errors and then introduces two potential solutions.
Please read the sections 'How to Tailor a Cost Function' and 'What Is Mean Absolute Error (MAE)?'. Pay close attention to: Why simply summing the errors (prediction - target) is a bad idea. How using the absolute value, |prediction - target|, solves this problem.
As the article explains, taking the absolute value of the error (leading to Mean Absolute Error or MAE) is a valid solution. However, another, more common approach in regression is to square the error.
Step 3: Squaring the Error
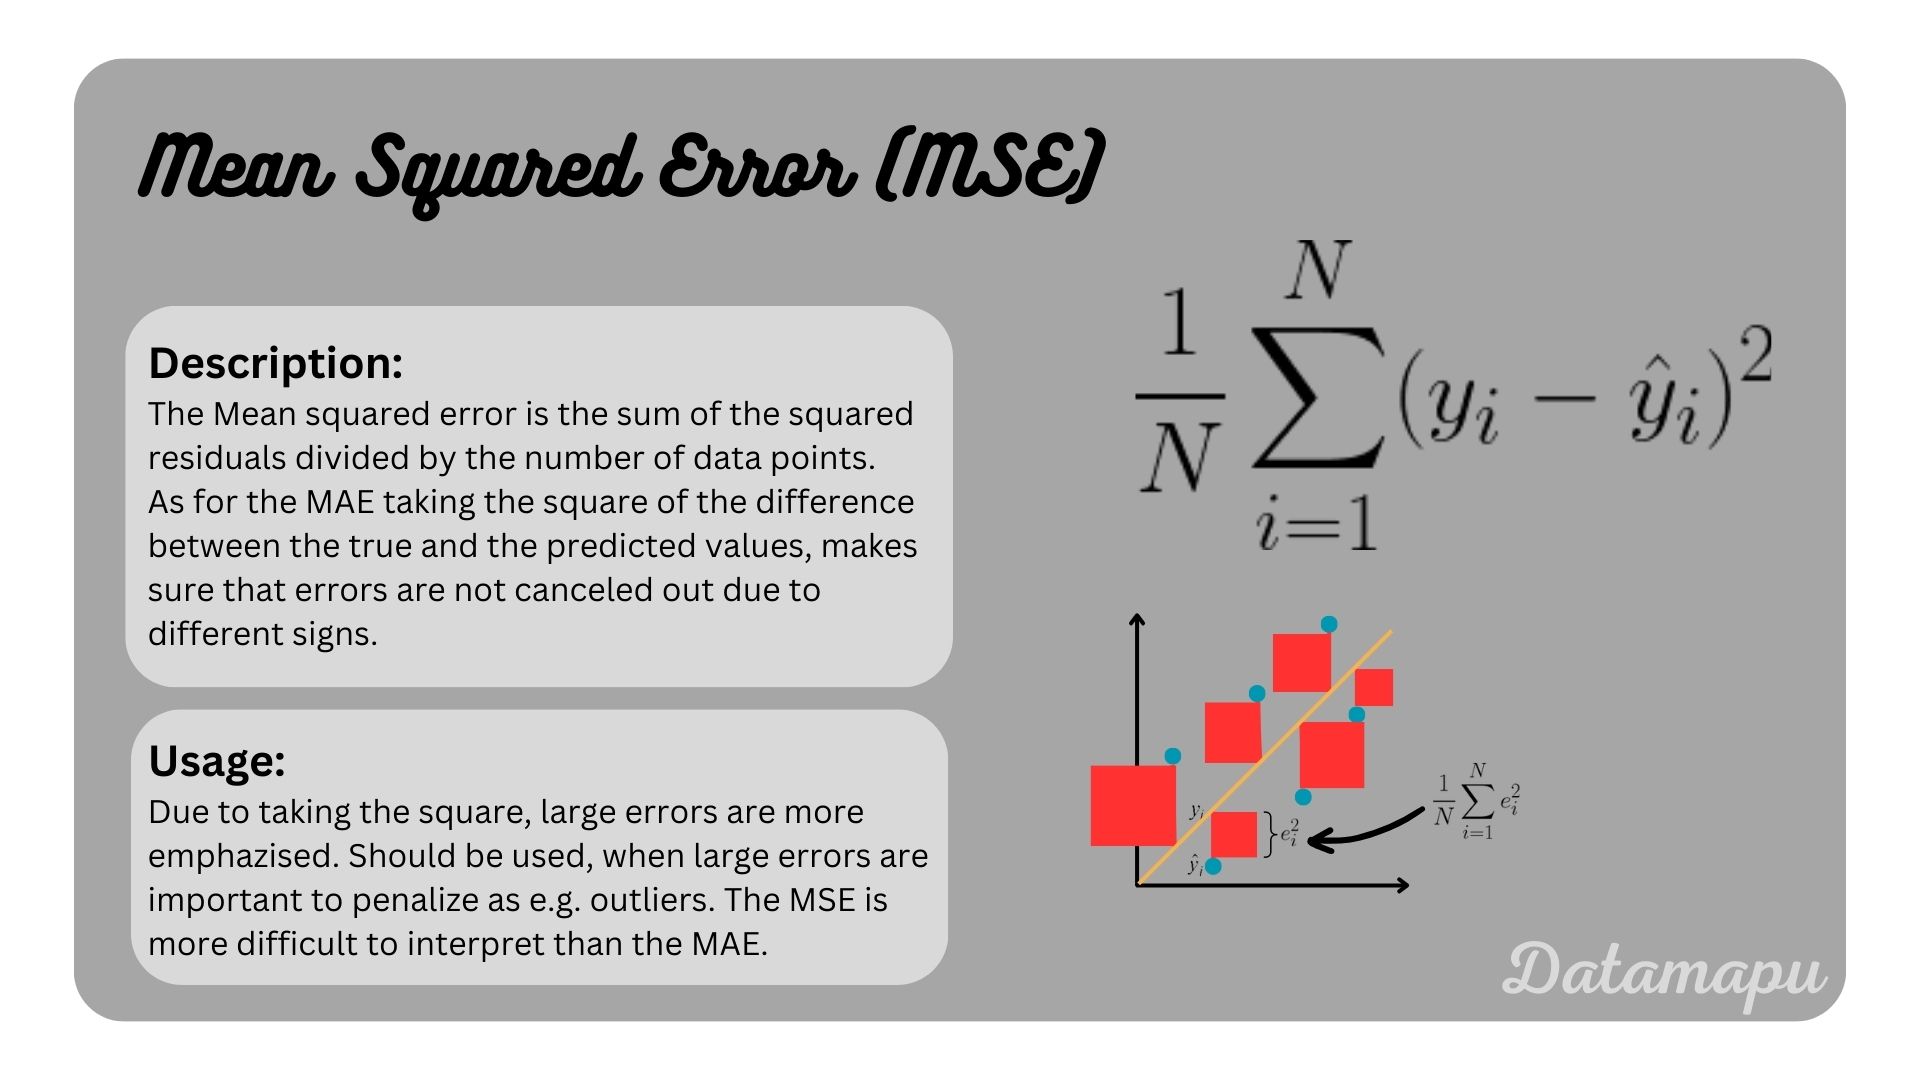
Instead of taking the absolute value, we can square the difference: . This also solves the cancellation problem by ensuring every error term is positive. Squaring the error has two desirable properties:
- It penalizes larger errors more heavily. An error of 2 becomes 4, but an error of 10 becomes 100. This means the model will be strongly motivated to fix its biggest mistakes.
- It creates a smooth, differentiable function. The squared function has a clean derivative, which is extremely useful for optimization algorithms like gradient descent, a topic we will cover soon. This is a significant advantage over the absolute value function.
The image below shows this concept visually. The error for each point is the vertical line, and the cost associated with that point is the area of the red square.
Step 4: Averaging the Squared Errors
Finally, to get a single cost value for the entire dataset, we sum up all the individual squared errors and divide by the number of data points, . This gives us the Mean Squared Error (MSE).
3. The Formal Definition of the MSE Cost Function
Now that we've built the intuition, let's formalize the MSE cost function, which we denote as .
To see this presented in a lecture format, let's turn to a classic explanation from Andrew Ng's course at Stanford.
Stanford CS229: Machine Learning - Linear Regression and Gradient Descent | Lecture 2 (Autumn 2018)
This video formally defines the cost function for linear regression. It brings together the concepts of squared error, summation, and averaging into a single, standard equation.
Watch the segment from 12:46 to 17:15. Focus on how Professor Ng constructs the cost function J(θ) and his explanation for each component, including the conventional 1/2 factor.
As explained in the video, the formal equation for the cost function is:
Let's break this down one last time:
- : These are the parameters of our model (e.g., and ). The cost is a function of these parameters. Our goal is to find the values of that minimize .
- : The number of examples in our training set.
- : A sum over all the training examples, from the first () to the last ().
- : The prediction of our model for the -th data point. Remember, this is our hypothesis function, e.g., .
- : The true, actual value for the -th data point.
- : The squared error for a single data point.
- : This makes it the mean squared error. It ensures the cost isn't dependent on the size of the dataset.
- : This is a constant included for mathematical convenience. When we later compute the derivative of this function to minimize it, this will conveniently cancel out the exponent '2' from the squared term, simplifying our calculations. It doesn't change the final values of that we find.
For a final, text-based summary of this derivation, please review the following resource.
Mathematical derivation of Cost Function and Gradient Descent
This article, 'Mathematical derivation of Cost Function and Gradient Descent,' provides a clear, step-by-step textual derivation of the MSE formula and explicitly discusses the purpose of the 1/2 factor.
Read the sections 'Cost Function' and 'Now, let’s derive the cost function from the ground up'. This will reinforce your understanding of the formula's components and the logic behind its construction.
4. A Concrete Example
Abstract formulas are best understood with a concrete example. The image below walks through the calculation of the MSE cost for a very simple model and a small dataset.
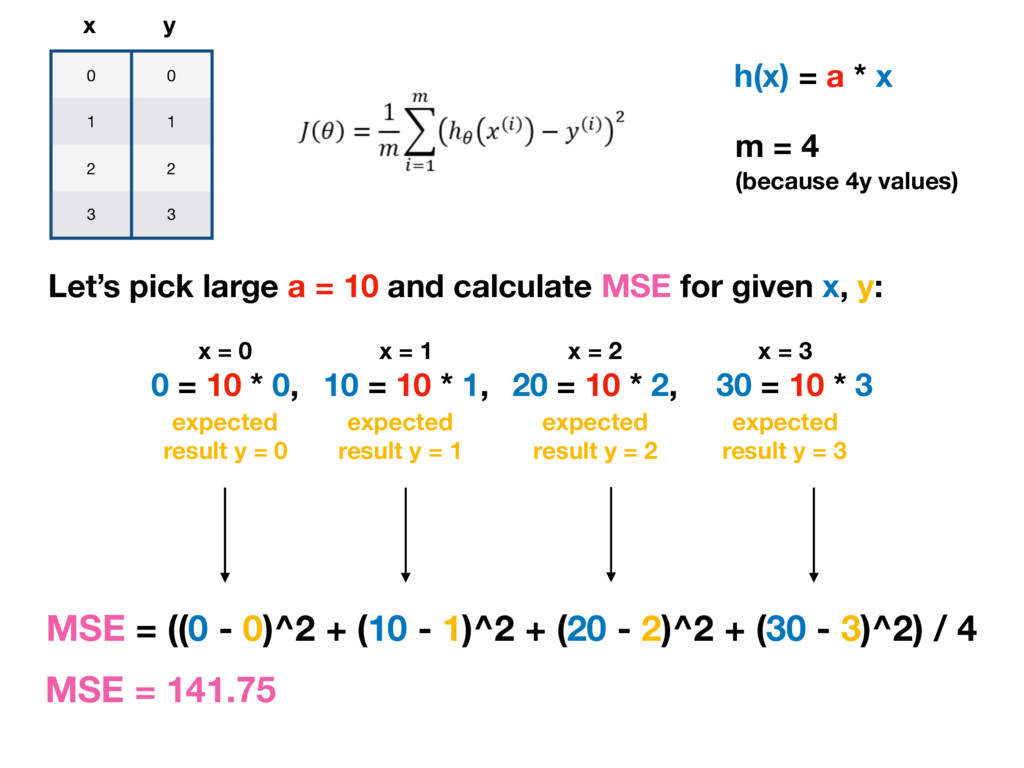
Following the steps in the image, we see that for a specific choice of parameters (in this case, a line with slope 10 and intercept 0), the cost is 141.75. If we were to choose a different slope, say a=8, we could repeat the calculation and get a different cost. The goal of training is to find the value of a that results in the lowest possible cost.
5. Visualizing the Cost Function
This leads to a powerful insight: the cost is itself a function of our model's parameters . For a simple linear regression with one feature, our parameters are (intercept) and (slope). This means the cost function is a 3D surface, where the x- and y-axes are and , and the z-axis is the cost . Our goal is to find the point () at the very bottom of this surface.
Let's watch a clip that visualizes a simpler, 2D version of this, showing how the cost changes as we vary just one parameter.
Gradient Descent, Step-by-Step
This clip from StatQuest's 'Gradient Descent, Step-by-Step' provides an excellent visualization of the cost function. It plots the 'Sum of Squared Residuals' against different values for the model's intercept, revealing the curve we need to minimize.
Watch from 02:42 to 04:55. Notice how changing the intercept parameter of the line results in a different value for the sum of squared residuals, creating a U-shaped curve. Our goal is to find the parameter value at the bottom of this curve.
Conclusion
In this lesson, we have moved from the abstract need for a "best-fit line" to a concrete, mathematical tool for finding it. We have derived, from first principles, the Mean Squared Error (MSE) cost function.
Key Takeaways:
- A cost function quantifies a model's total error into a single number, allowing us to objectively compare different models.
- For linear regression, the standard cost function is Mean Squared Error (MSE), which is the average of the squared differences between predicted and actual values.
- The formula is .
- We use MSE because it penalizes large errors heavily and its mathematical properties (being smooth and differentiable) make it easy to minimize.
- The goal of training a linear regression model is to find the set of parameters () that results in the minimum possible cost.
Preview of the Next Lesson:
We now have a precise definition of our model () and a way to measure its error (). The next logical step is to bring these theoretical concepts into the practical realm of code.
In the next lesson, we will begin our transition from theory to application by addressing the outcome: Implement the prediction and cost functions for linear regression using NumPy. You will write Python code that directly translates these mathematical formulas, setting the stage for the subsequent lesson where we will build an algorithm to automatically find the parameters that minimize this cost.