Introduction
In our last lesson, we explored how polynomial regression allows us to model complex, non-linear relationships in data. We saw visually how a simple straight line can underfit the data, while a very complex polynomial can overfit it by memorizing noise. This left us with a critical question: how do we move beyond a visual "goodness of fit" to a precise, numerical measure of a model's performance?
This lesson provides the answer. Your goal here is to learn how to evaluate regression models using metrics like Mean Squared Error (MSE) and R-squared. Mastering these metrics is fundamental to your journey in AI. They are the tools that allow you to objectively compare different models, tune their complexity, and ultimately select the one that will perform best on new, unseen data. This is a core skill for building robust and reliable AI systems.
We will cover:
- The foundational concept of residuals (errors).
- Mean Squared Error (MSE), a metric that heavily penalizes large errors.
- R-squared (R²), a metric that measures the proportion of variance your model explains.
- How to choose the right metric for your specific problem.
The Language of Error: Residuals
Before we can measure a model's performance, we first need to define what an "error" is in the context of regression. The most basic building block for almost all regression metrics is the residual.
A residual is simply the difference between the actual observed value () and the value predicted by your model ().
To get a formal definition and see a visual representation of residuals, please read the following brief section from an excellent overview by NVIDIA.
A Comprehensive Overview of Regression Evaluation Metrics
This article, 'A Comprehensive Overview of Regression Evaluation Metrics', starts by defining the fundamental concept of residuals.
Please read the section titled 'A quick primer on residuals'. Focus on the definition and the accompanying diagram (Figure 1), which illustrates the concept clearly.
As the article notes, if we simply sum up all the residuals, the positive errors (where the model under-predicted) and negative errors (where it over-predicted) would cancel each other out. This could give us a false impression that our model has very low error, when in fact it might be making large mistakes in both directions.
To solve this, evaluation metrics typically use one of two strategies: squaring the residuals or taking their absolute value. Let's explore the most common squared-error metric first.
Measuring Average Error: MSE and its Relatives
The Mean Squared Error (MSE) is one of the most important metrics in machine learning. In fact, it's the very cost function that the linear regression algorithm minimizes during training. As an evaluation metric, it gives us a measure of the average squared difference between the predictions and the actual values.
The formula for MSE is:
Where:
- is the number of data points.
- is the actual value for the -th data point.
- is the predicted value for the -th data point.
The key characteristic of MSE is that by squaring each residual, it gives a much heavier penalty to large errors than to small ones. For example, an error of 10 contributes 100 to the sum, while an error of 2 contributes only 4.
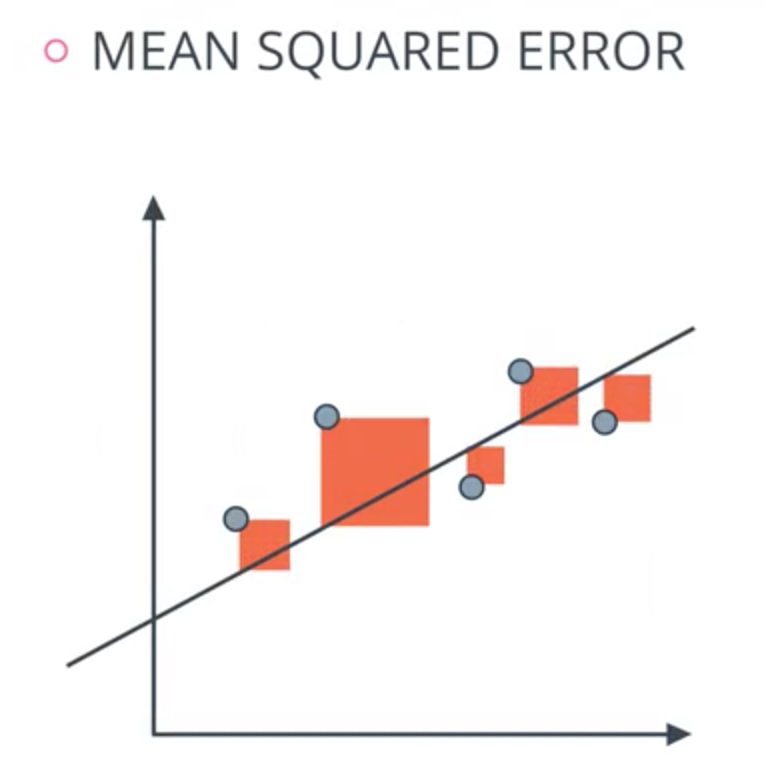
While powerful, MSE has a drawback: its units are the square of the target variable's units (e.g., dollars squared), which can be hard to interpret. To fix this, we often use the Root Mean Squared Error (RMSE).
- RMSE is simply the square root of the MSE: .
- Its main advantage is that it's in the same units as the target variable, making it much more intuitive. An RMSE of 15,000 for a house price prediction model means the model's predictions are, in a sense, typically off by about $15,000.
Another common metric is the Mean Absolute Error (MAE).
- MAE is the average of the absolute values of the residuals: .
- Unlike MSE, MAE treats all errors linearly. It does not disproportionately penalize large errors, which makes it less sensitive to outliers.
The following video provides a quick and clear summary of these three error metrics.
How to evaluate ML models | Evaluation metrics for machine learning
The video 'How to evaluate ML models' gives a concise overview of the key error-based metrics for regression.
Watch the segment from 06:04 to 07:36. It covers Mean Absolute Error (MAE), Mean Squared Error (MSE), and Root Mean Squared Error (RMSE) in quick succession.
Measuring Goodness of Fit: R-squared (R²)
MSE, RMSE, and MAE are absolute metrics; they tell you the magnitude of the error in the units of your target variable. A "high" or "low" MSE is relative to the problem.
R-squared (R²), also known as the coefficient of determination, is a relative metric. It answers a different question: How much better is our model than a naive baseline model?
What is this naive baseline? It's a model that simply predicts the mean (the average) of the target variable for every single data point, regardless of the input features.
R² tells you the proportion of the variance in the target variable that is explained by your model.
The following video from the StatQuest channel is one of the best explanations available for building an intuition for R-squared.
R-squared, Clearly Explained!!!
In 'R-squared, Clearly Explained!!!', Josh Starmer breaks down this concept step-by-step, starting from the variation around the mean and building up to the full formula.
Please watch from 00:18 to 06:25. Pay close attention to how he compares the 'variation around the mean' to the 'variation around the line' to quantify the model's improvement.
As explained in the video, the formula for R² is:
Let's break down the components:
- Residual Sum of Squares (RSS): . This is the unexplained variance—the sum of squared errors from our model.
- Total Sum of Squares (TSS): . This is the total variance in the data—the sum of squared differences between each data point and the overall mean ().
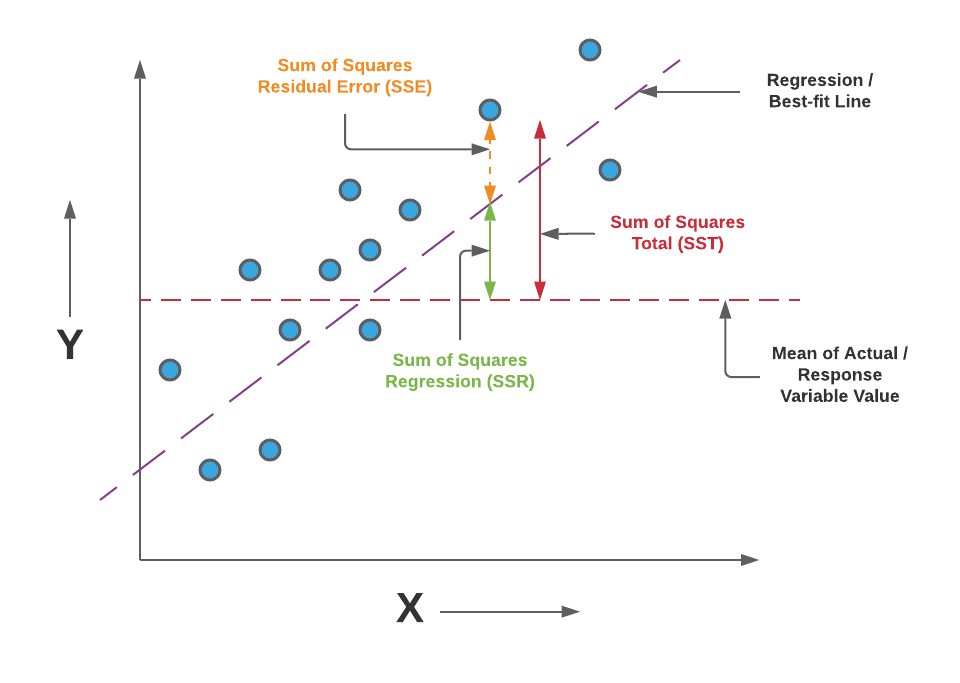
Interpreting R²:
- An R² of 0.81 means that 81% of the variability observed in the target variable is explained by your model's features.
- An R² of 1.0 means the model explains 100% of the variability (a perfect fit).
- An R² of 0.0 means your model is no better than the naive baseline of just predicting the mean.
- A negative R² is possible! This means your model is performing worse than the simple mean. This can happen if you evaluate your model on new test data and it generalizes very poorly.
When to Use Which Metric?
Now that you know the main evaluation metrics, how do you choose which one to use? The answer depends on your project's goals and the nature of your data.
Regression Model Evaluation Metrics: R-Squared, Adjusted R ...
This article, 'Regression Model Evaluation Metrics', provides an excellent comparison of the metrics we've discussed and gives practical advice on when to choose one over the others.
Please read the two subsections under the 'Comparative Analysis' heading: 'Comparison of the Different Metrics' and 'Discuss Scenarios to Choose One Over the Others'.
Here's a summary of the key decision points:
-
RMSE vs. MAE:
- Choose RMSE if large errors are particularly undesirable for your application. The squaring of errors means that a few large misses will drastically increase the RMSE, signaling a problem.
- Choose MAE if your data has outliers that you don't want to dominate the metric, or if all errors, regardless of size, have an equal business cost.
-
R-squared:
- R² is excellent for communicating the overall explanatory power of your model to both technical and non-technical audiences. A statement like "our model explains 75% of the variation in house prices" is very intuitive.
- However, be cautious. R² can be artificially inflated by adding more features to the model, even if they are not useful. This is a lead-in to more advanced concepts like Adjusted R-squared, which penalizes model complexity.
In practice, you will often report several of these metrics to give a comprehensive view of your model's performance.
Conclusion
You have now learned how to numerically and objectively evaluate the performance of your regression models. This is a massive step up from relying on visual inspection and is a cornerstone of professional machine learning practice.
Key Takeaways:
- Evaluation begins with residuals, the difference between actual and predicted values.
- MSE and RMSE measure the average error, but they heavily penalize large mistakes due to the squaring of residuals. RMSE is often preferred for its interpretability.
- MAE also measures the average error but is less sensitive to outliers because it does not square the residuals.
- R-squared (R²) is a relative metric that measures the proportion of variance in the data that your model successfully explains, comparing it to a baseline model that only predicts the mean.
Preview of the Next Lesson:
We have now covered the essentials of building and evaluating models that predict continuous numerical values (regression). For the next part of your journey, we will pivot to a different, but equally important, type of problem: classification. Instead of predicting a number (like price), you will learn to predict a category (like "spam" or "not spam"). We will begin by exploring one of the most fundamental classification algorithms: logistic regression.