Introduction
Welcome to your first lesson on classification, a new and exciting domain of machine learning. In the previous module, we focused entirely on regression—building models to predict continuous numerical values like the price of a house. You learned to build linear and polynomial models and, crucially, to evaluate their performance with metrics like MSE and R².
Now, we pivot to a different kind of problem. What if the goal isn't to predict a number, but to predict a category? For instance:
- Will a student pass or fail an exam? (Pass/Fail)
- Is an email spam or not spam? (Spam/Not Spam)
- Does a medical image show a malignant or benign tumor? (Malignant/Benign)
These are all classification problems. This lesson introduces one of the most fundamental and widely used classification algorithms: logistic regression. Your learning outcome is to explain logistic regression and the role of the sigmoid function for classification. We will explore why linear regression is unsuitable for this task and how logistic regression elegantly solves the problem by framing it in terms of probability.
Why Linear Regression Fails for Classification
Let's start with a thought experiment. Imagine we have data on students, mapping hours studied to whether they passed (1) or failed (0) an exam. Could we just fit a standard linear regression line to this data?
At first, it might seem plausible. A line could trend upwards, suggesting that more study hours lead to a higher "score." However, this approach has two critical flaws.
To see these flaws clearly, let's watch a short video that sets up this exact problem.
Logistic Regression (and why it's different from Linear Regression)
The video 'Logistic Regression (and why it's different from Linear Regression)' by Visually Explained starts by demonstrating the issues with applying a linear model to a classification task.
Watch the video from the beginning until 02:41. Pay close attention to the two main problems the video highlights when using linear regression for a pass/fail prediction.
As the video explained, the two major issues are:
- Unbounded Outputs: A linear regression model can output any real number. It might predict a value of 1.3 or -0.2. What does it mean to have a 130% chance of passing, or a -20% chance? These values are not interpretable as probabilities, which should always be between 0 and 1.
- Poor Fit: The straight line of a linear model doesn't accurately represent the nature of classification data, which often clusters at the extremes (0 and 1). A simple outlier can drastically change the slope of the line, shifting the decision point in a non-intuitive way.
We need a model that is specifically designed to output a probability. This is where logistic regression comes in.
The Heart of Logistic Regression: The Sigmoid Function
Logistic regression solves the problems of linear regression by introducing a new component: the sigmoid function, also known as the logistic function.
The core idea is simple yet powerful:
- We start with the same linear equation as before: . This combines our features () and weights () to produce a score, . This score can be any real number.
- Instead of using as the final output, we pass it through the sigmoid function, which "squashes" the value into a range between 0 and 1.
The sigmoid function is defined as:
This "S"-shaped curve is the key to transforming the unbounded output of a linear equation into a meaningful probability.
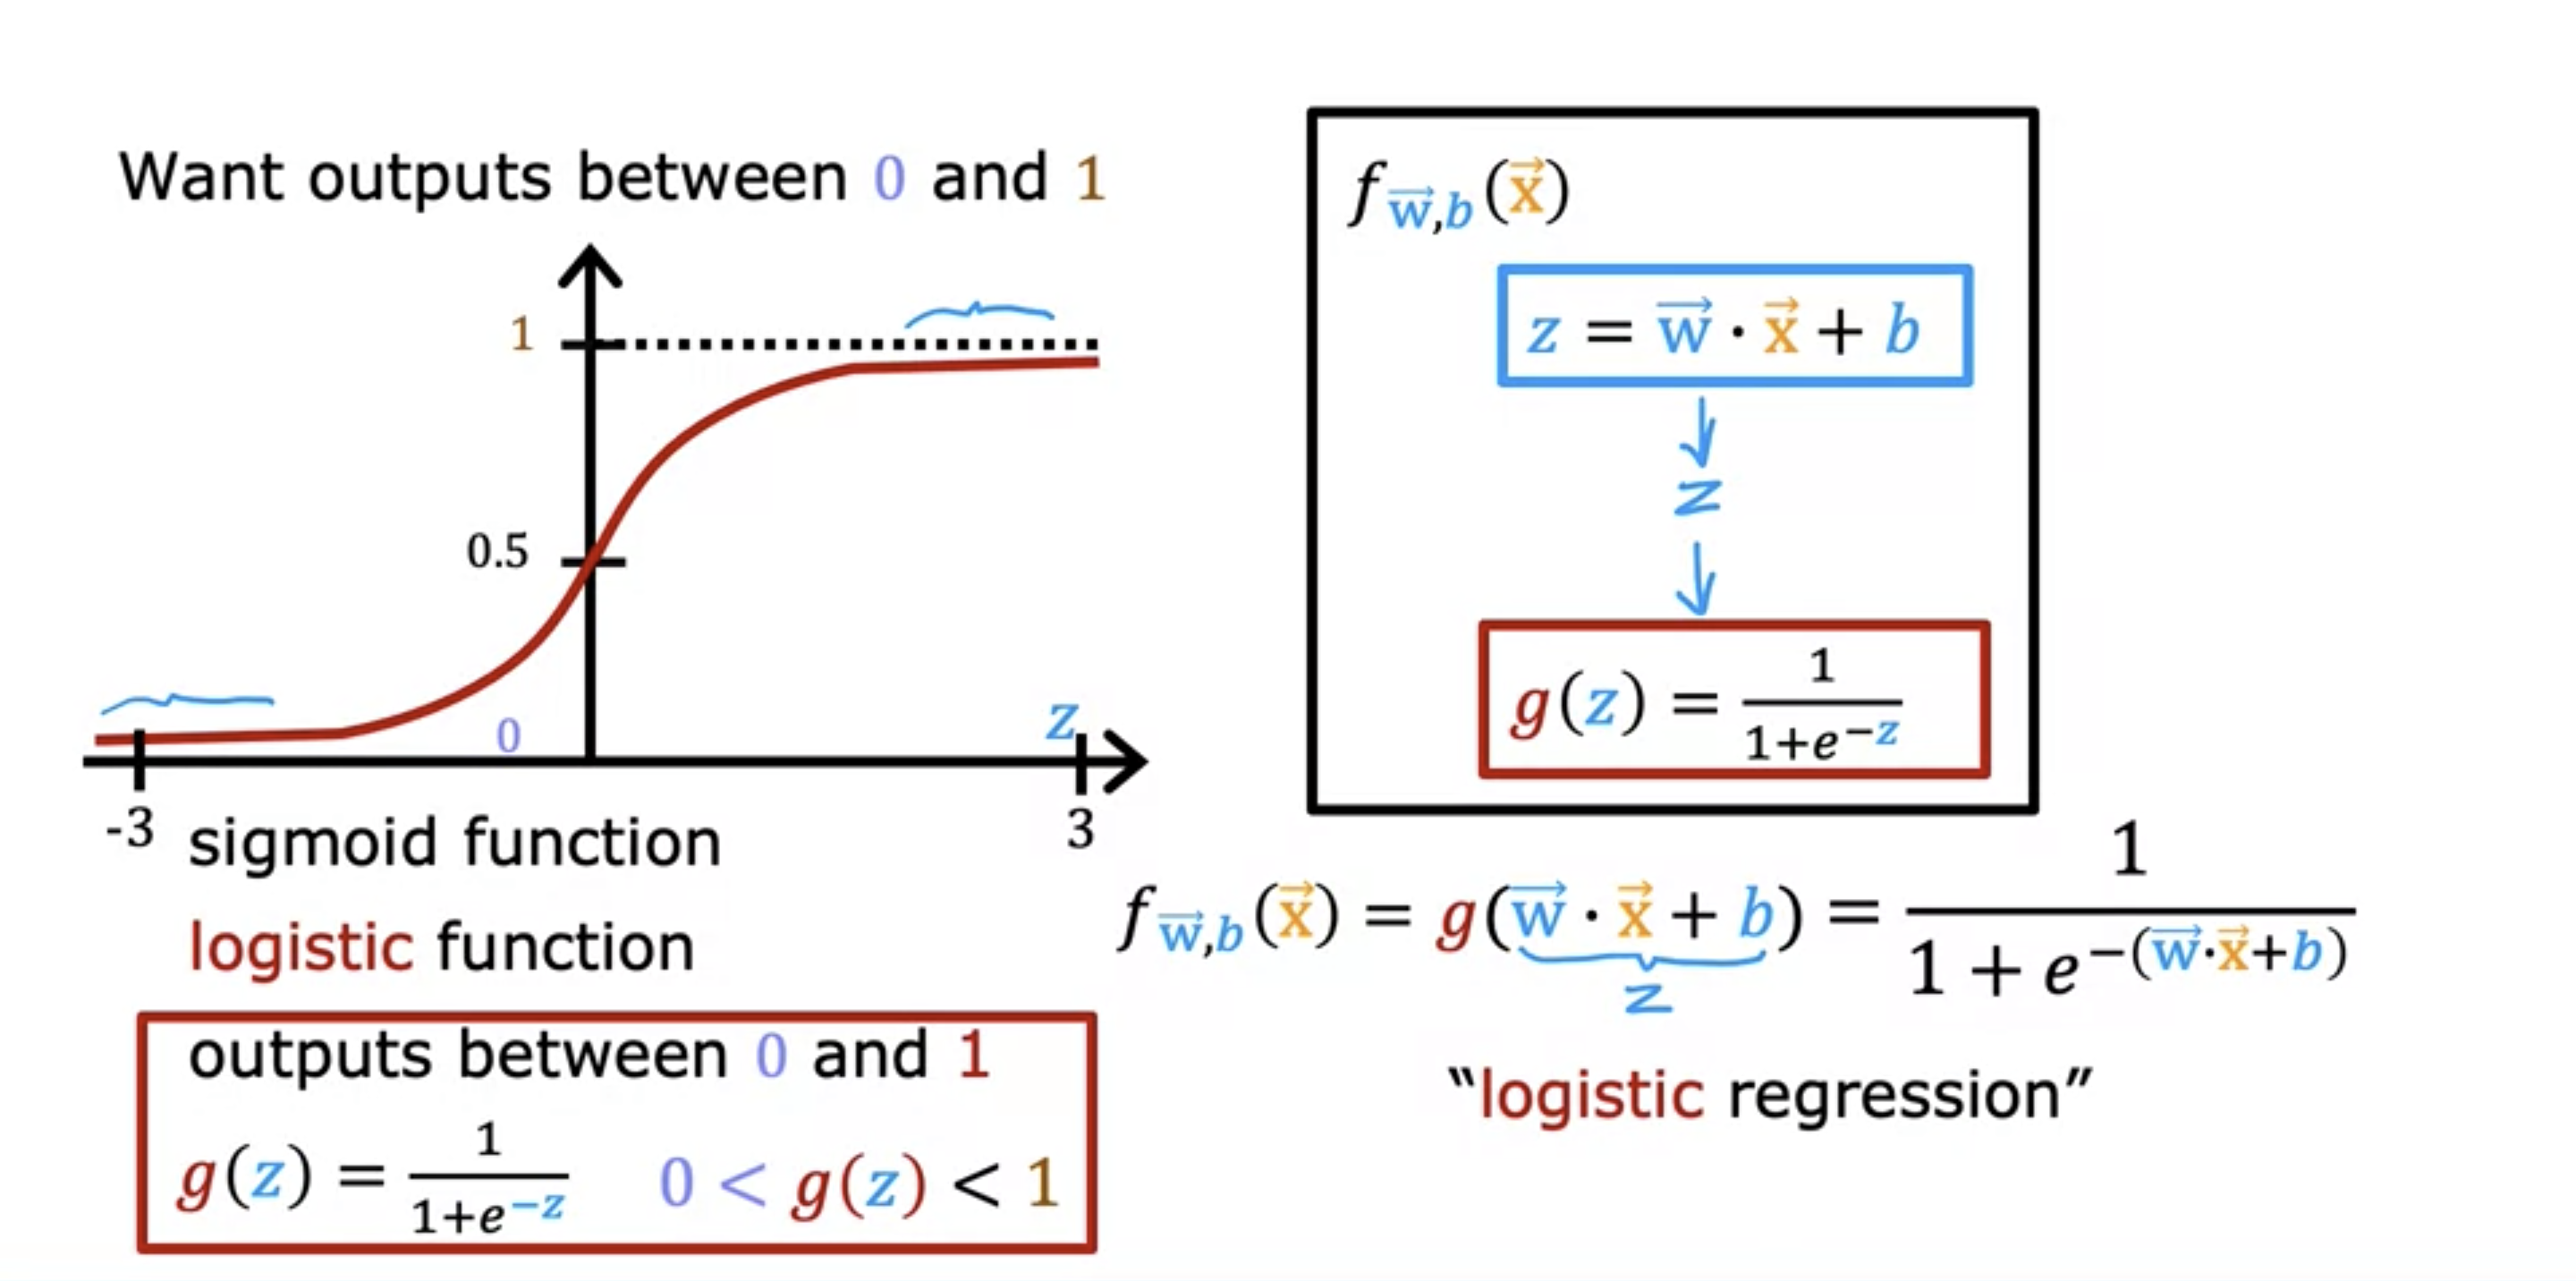
Let's watch a brief, intuitive explanation of how this works in practice.
StatQuest: Logistic Regression
The 'StatQuest: Logistic Regression' video provides a very clear, high-level overview of how the S-shaped curve is used to model probabilities.
Watch from 03:01 to 04:14. Notice how the S-curve naturally maps the input feature (mouse weight) to the probability of the outcome (being obese).
The output of the sigmoid function, , is interpreted as the probability that the given input belongs to the positive class (often labeled '1'). For our student example, it's the probability of passing the exam.
- If is a large positive number (e.g., many hours studied), approaches 0, and approaches .
- If is a large negative number, becomes very large, and approaches 0.
- If , then , and .
So, the logistic regression model's prediction is formally written as:
where is the predicted probability that the outcome is 1, given the input features .
From Probability to a Final Decision
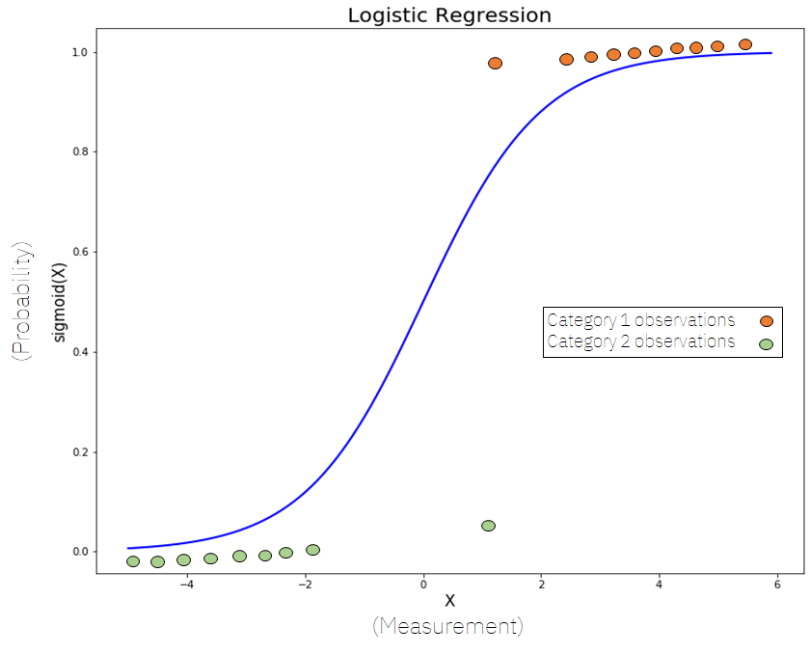
The model now gives us a probability, but our goal is to make a definite classification (e.g., "Pass" or "Fail"). To do this, we set a decision boundary, which is a threshold for the probability.
The most common threshold is 0.5. The rule is simple:
- If , we predict Class 1 (Pass).
- If , we predict Class 0 (Fail).
Because the sigmoid function outputs 0.5 when its input is 0, this threshold directly relates back to our linear equation:
- Predict Class 1 when .
- Predict Class 0 when .
The line defined by is the decision boundary that separates the two classes in the feature space.
The Mathematical Origin of the Sigmoid Function
You have a preference for understanding the theory first, so you might be asking: why this specific S-shaped function? Where does it come from? The choice is not arbitrary; it's derived from a linear model of log-odds.
Let's break this down.
- Probability (p): The probability of an event happening. Range: [0, 1].
- Odds: The ratio of the probability of the event happening to it not happening. Odds = . Range: [0, ).
- Log-odds (or logit): The natural logarithm of the odds. Log-odds = . Range: ().
Notice that the log-odds are unbounded, just like the output of a linear equation. The core assumption of logistic regression is that the log-odds of the outcome are a linear function of the input features.
This elegant assumption connects the unbounded linear model to our problem. If we now solve this equation algebraically for , we get back precisely the sigmoid function!
For a more detailed look at the mathematics, please read the following sections.
Logistic Regression in Machine Learning
The article 'Logistic Regression in Machine Learning' from GeeksForGeeks provides a clear mathematical walkthrough, from the linear model to the final sigmoid-based probability.
Please read the sections titled 'Understanding Sigmoid Function', 'How does Logistic Regression work?', and 'Logistic Regression Equation and Odds:'. Focus on how the article builds from the linear equation z to the sigmoid probability sigma(z), and then shows the derivation of the final probability formula starting from the log-odds equation.
This derivation is a beautiful example of how a constrained problem (predicting probabilities between 0 and 1) can be solved by transforming it into an unconstrained space (log-odds), applying a simple linear model, and then transforming the result back.
Conclusion
In this lesson, you have transitioned from regression to classification and learned the theoretical underpinnings of logistic regression. This algorithm is a cornerstone of machine learning, serving not only as a powerful classification tool in its own right but also as a building block for more complex models like neural networks.
Key Takeaways:
- Classification is the task of predicting a discrete category, unlike regression, which predicts a continuous value.
- Linear regression is unsuitable for classification because its output is unbounded and not easily interpreted as a probability.
- Logistic regression solves this by using a linear model () as the input to the sigmoid function.
- The sigmoid function, , "squashes" any real-valued input into a probability between 0 and 1.
- The model's output is the probability of the input belonging to the positive class (1). A decision threshold (typically 0.5) is then used to make the final classification.
- The sigmoid function is mathematically derived from the assumption that the log-odds of the outcome are a linear function of the features.
Preview of the Next Lesson:
Now that you have a solid grasp of the theory, it's time to put it into practice. In the next lesson, you will train and evaluate your first logistic regression model using the scikit-learn library in Python, applying these concepts to a real dataset.