Introduction
In our last lesson, you learned how to use the powerful scikit-learn library to fit and interpret linear regression models. We saw that linear regression is excellent at finding the best straight-line relationship in data. However, real-world relationships are rarely so simple. What happens when the pattern in your data is curved?
This lesson addresses that exact challenge. You will learn how to model these non-linear relationships using a clever extension of linear regression. Our goal is to explain how polynomial regression can capture non-linear relationships.
This is a key step in building more sophisticated models. By understanding how to transform features, you unlock the ability to make a simple algorithm like linear regression solve a much wider class of problems—a core concept on your path to mastering AI.
We will cover:
- The limitations of linear regression for curved data.
- The mathematical form of a polynomial regression model.
- The "trick" of feature engineering that allows a linear model to fit a curve.
- The critical trade-off between model complexity and performance (underfitting vs. overfitting).
When a Straight Line Isn't Enough
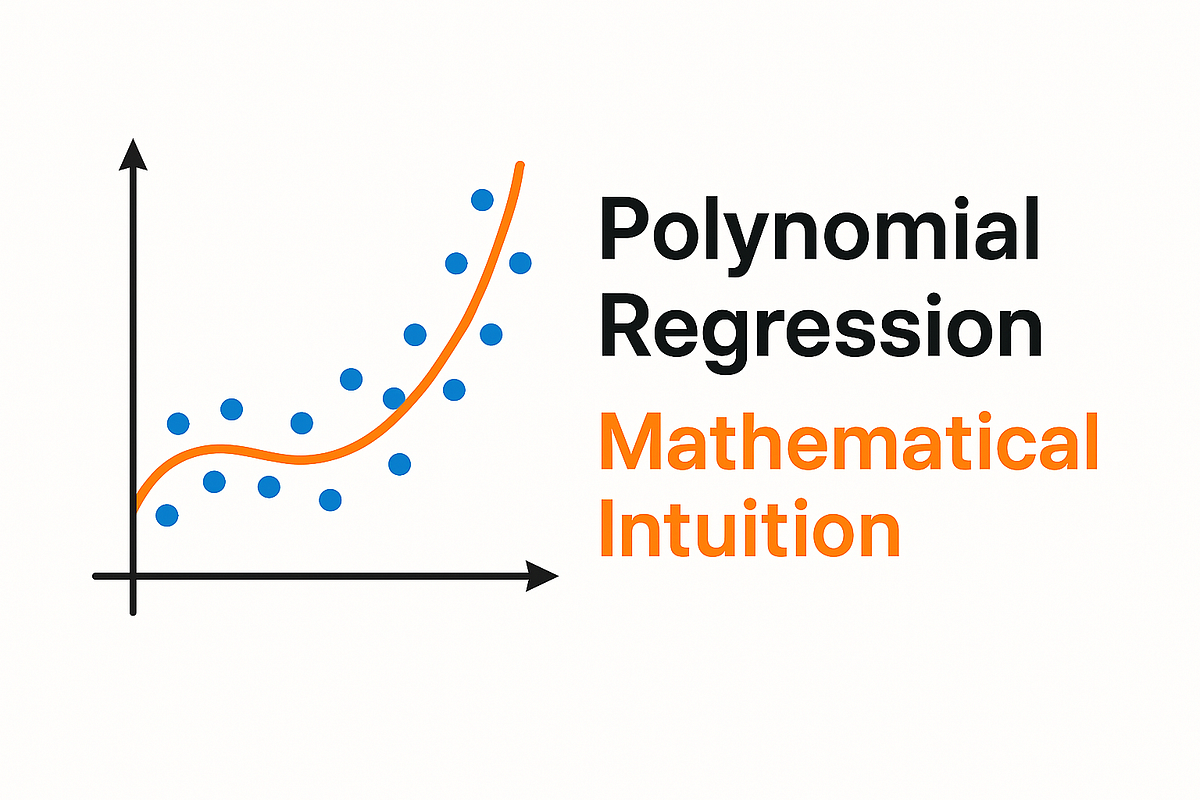
Imagine plotting data where the underlying pattern is a curve. If we try to fit a standard linear regression model, it will draw the best possible straight line, but it will fail to capture the essence of the relationship.

This failure of a simple model to capture the underlying trend is called underfitting. To fix this, we need a model that can bend. This is where polynomial regression comes in.
The Theory: Bending the Line with Polynomials
To understand polynomial regression, let's first recall the equation for a simple linear model:
Here, is the target, is the feature, is the intercept, is the slope, and is the error term.
Polynomial regression extends this equation by adding higher-order powers of the feature . A second-degree (or quadratic) polynomial regression model looks like this:
By adding the term, we give the model the ability to create a parabolic curve. We can add even higher powers to create more complex curves. The general form of a polynomial regression model of degree is:
To solidify this foundational theory, please read the following brief introduction.
9.7 - Polynomial Regression | STAT 501
This resource from Penn State's STAT 501 course provides a formal definition of the polynomial regression model and clarifies a very important point about why it's still considered a type of linear regression.
Read the initial section of the page, starting from the heading '9.7 - Polynomial Regression' down to just before the data table. Focus on the equation and the definition of the 'degree'.
The key insight from the reading is that even though the model describes a non-linear relationship between and , it is linear in its coefficients (). The algorithm's job is to find the best values for these coefficients, and from the algorithm's perspective, this is a linear problem.
The following video provides an excellent walkthrough of these core concepts with visual examples.
The video 'Polynomial regression' by Mike X Cohen will help you visualize what a polynomial is and how polynomial regression works.
Please watch the first 5 minutes and 21 seconds of the video, covering these parts: What is a Polynomial? (00:00 - 03:09): This section defines a polynomial, its components (coefficients, powers), and introduces the polynomial regression equation. Linearity in Coefficients (03:09 - 04:21): This is a crucial clarification. Pay close attention to why this is still a 'general linear model'. Visual Examples (04:21 - 05:21): See how second-order and third-order polynomials fit different non-linear data patterns.
The "Trick": Feature Engineering
So, if we're using a linear regression algorithm to fit a non-linear curve, how does that work? The answer lies in a powerful technique called feature engineering.
Instead of changing the algorithm, we change the data we feed into it.
Consider the quadratic equation: .
Let's create a new feature, let's call it , where . If we substitute this into our equation, we get:
This is the exact form of a multiple linear regression model, which you saw in the previous lesson! The model doesn't know or care that is just the square of . It treats them as two independent features and finds the best coefficients ( and ) for them.
By transforming our single feature x into multiple features (x, x^2, x^3, etc.), we can use a linear regression model to fit a complex curve.
This next video explains this transformation process beautifully.
Polynomial Regression for Machine Learning
The video 'Polynomial Regression for Machine Learning' by Kody Simpson provides a clear, practical explanation of the feature transformation at the heart of polynomial regression.
Watch the segment from 03:10 to 05:11. The creator does a fantastic job of showing, by hand, how the input data matrix is transformed by adding new columns for the polynomial features. This directly connects to what you learned about multiple linear regression.
This idea of "changing the data, not the model" is a fundamental concept in machine learning. It's a prime example of the kind of thinking that allows you to solve complex problems with simpler, well-understood tools.
The Danger: Choosing the Right Degree
If adding an term is good, is adding up to even better? Not necessarily. This brings us to one of the most important concepts in all of machine learning: the bias-variance tradeoff, which manifests here as a choice between underfitting and overfitting.
- Underfitting (High Bias): If the degree of our polynomial is too low (e.g., using a straight line for curved data), the model is too simple. It can't capture the underlying pattern.
- Overfitting (High Variance): If the degree is too high, the model becomes too flexible. It will start to wiggle and contort itself to pass through as many data points as possible, essentially "memorizing" the noise in the training data. This model will look great on the data it was trained on, but it will fail miserably when asked to make predictions on new, unseen data because it hasn't learned the true underlying relationship.
The goal is to find the "sweet spot"—a model that is complex enough to capture the true pattern but not so complex that it mistakes noise for a signal.
Polynomial Regression Explained: Math, Python Code & Overfitting
This article provides a concise explanation of overfitting in the context of polynomial regression.
Read the section titled 'The Danger Zone: Overfitting'. It clearly illustrates the difference between underfitting, a good fit, and overfitting using polynomial degrees as an example.
The video from Kody Simpson also has an excellent segment illustrating this trade-off.
Polynomial Regression for Machine Learning
Let's return to Kody Simpson's video to see a visual demonstration of underfitting and overfitting.
Watch the part from 06:14 to 08:49. Pay close attention to how the curve changes as the degree increases from 1 (underfitting) to 300 (severe overfitting).
Determining the optimal degree is a key part of the modeling process. In practice, this is often done by evaluating model performance on a separate test set for different degrees and choosing the one that generalizes best.
Conclusion
In this lesson, you have moved beyond straight lines and learned how to model the curves that are common in real-world data. You've discovered that you can achieve this without abandoning the linear regression framework you're familiar with, but by cleverly engineering your features.
Key Takeaways:
- Polynomial regression models non-linear relationships by adding higher-order terms () of a feature to the regression equation.
- It is still considered a linear model because the equation is linear in its coefficients ().
- The core mechanism is feature engineering: transforming the original feature set into a new, higher-dimensional one that a linear algorithm can use to fit a curve.
- Choosing the polynomial degree involves a crucial trade-off. A low degree can lead to underfitting, while a high degree can lead to overfitting.
Preview of the Next Lesson:
We've talked about "good" and "bad" fits, but how do we measure this numerically? In the next lesson, you will learn about key evaluation metrics for regression, such as Mean Squared Error (MSE) and R-squared. These metrics will allow you to quantitatively compare different models and make data-driven decisions about which one is best.