Introduction
In our last lesson on evaluating clustering, we saw that metrics like the silhouette score can become less reliable in high-dimensional spaces—a phenomenon you briefly encountered as the "curse of dimensionality." We concluded that for many real-world datasets with dozens, hundreds, or even thousands of features, we need a way to simplify the data before we can effectively analyze it.
This lesson directly tackles that challenge. Our learning outcome is to explain the purpose of dimensionality reduction for visualization and model performance. We will explore what high-dimensional data is, why it's problematic, and how reducing the number of features (or "dimensions") can lead to faster, more robust models and clearer insights. This is a fundamental concept in machine learning, acting as a critical pre-processing step for many of the advanced AI systems you aim to build.
Part 1: The Challenge of Visualizing High-Dimensional Data
In data science, a "dimension" is simply a feature or an attribute of your data. A dataset with two features (e.g., height and weight) is two-dimensional. A dataset with ten features is ten-dimensional. While we can easily plot and visually inspect data in two or three dimensions, our intuition breaks down completely beyond that. How would you visualize a point in a 100-dimensional space?
This inability to "see" the data makes it incredibly difficult to understand its structure, identify patterns, or spot clusters.
To get a concrete sense of this problem, let's watch a short video that illustrates how visualization becomes progressively harder as we add dimensions.
Principal Component Analysis (PCA) Explained: Simplify Complex Data for Machine Learning
The video 'Principal Component Analysis (PCA) Explained' by IBM Technology provides an excellent visual demonstration of the visualization problem. It starts with a simple 1D plot and builds up.
Watch the segment from 01:36 to 03:07. Notice how the visualization moves from a simple line (1D), to a scatter plot (2D), to a 3D plot, and then hits a conceptual wall when trying to add a fourth dimension.
As the video shows, we quickly run out of spatial axes. Dimensionality reduction techniques are designed to solve this by projecting the data down into a lower-dimensional space (typically 2D or 3D) that we can visualize. The goal is to create this simplified view while losing as little important information as possible.
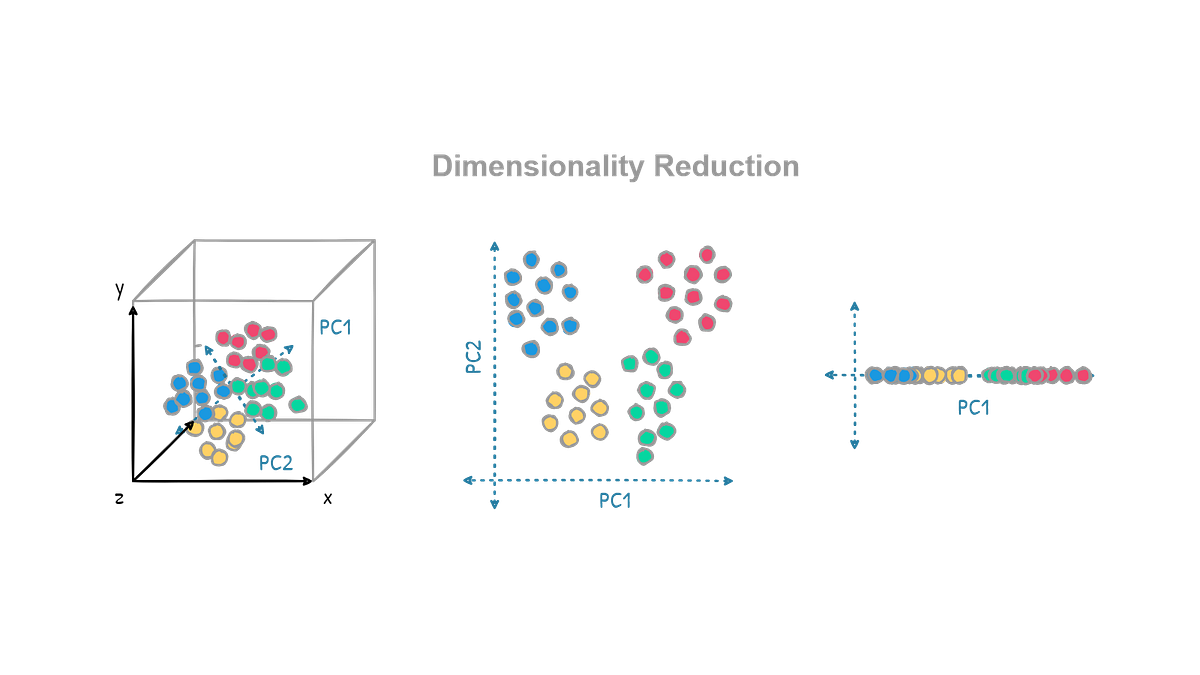
This process allows us to "see" the structure of a 100-dimensional dataset on a simple 2D scatter plot, revealing clusters and relationships that would otherwise be invisible.
Part 2: The "Curse of Dimensionality" and Model Performance
The problems with high-dimensional data go far beyond just visualization. They can severely degrade the performance of machine learning models, a phenomenon famously known as the "curse of dimensionality."
Let's read a concise explanation of the core issues that arise when we have too many features.
Understanding Dimensionality Reduction
The article 'Understanding Dimensionality Reduction' from DataCamp clearly lays out the main problems associated with high-dimensional data.
Read the section titled 'Why Dimensionality Reduction?'. Focus on the four issues listed: the curse of dimensionality, overfitting, computational complexity, and visualization challenges.
Let's break down the three key problems affecting model performance from that reading:
-
Data Sparsity: As you add more dimensions, the data points become increasingly spread out. The volume of the space grows exponentially, but your number of data points does not. This makes the data "sparse." For algorithms like k-means or k-nearest neighbors that rely on the concept of distance or density, this is a disaster. If every point is far away from every other point, the notion of a "neighborhood" or "cluster" loses its meaning.
-
Overfitting: When you have many more features than data points, a model can become overly complex. It starts to learn the random noise and idiosyncrasies of your specific training data, rather than the true underlying pattern. As a result, the model performs exceptionally well on the data it has already seen but fails to generalize to new, unseen data. Reducing dimensions helps the model focus on the most important signals, making it more robust.
-
Computational Complexity: Simply put, more dimensions mean more numbers to process. The computational cost of training a model and making predictions increases with the number of features. This can make model development slow and expensive, especially with very large datasets.
The following graph powerfully illustrates the effect of the curse of dimensionality on model performance.

Part 3: The Purpose and Benefits of Dimensionality Reduction
Now that we understand the problems, we can define the purpose of dimensionality reduction: it is a set of techniques used to reduce the number of features in a dataset while retaining as much meaningful information as possible.
By doing so, we aim to achieve several key benefits that directly address the challenges we've discussed.
What is Dimensionality Reduction? A Guide.
To consolidate these ideas, let's review a clear summary of the reasons for and key features of dimensionality reduction from the Roboflow Blog.
Read the sections 'Why is Dimensionality Reduction Necessary?' and 'Key Features of Dimensionality Reduction'. This will reinforce and expand upon the concepts from the previous reading.
To summarize, the core purposes of dimensionality reduction are:
- To Improve Model Performance: By reducing the number of features, we can mitigate overfitting and help the model generalize better to new data. By filtering out irrelevant "noise" features, we improve the signal-to-noise ratio, allowing the model to learn more effectively.
- To Increase Computational Efficiency: Fewer features mean less data to store and process, leading to significantly faster model training and inference times. This is crucial for real-time applications and for iterating quickly during model development.
- To Enable Data Visualization and Interpretation: As we saw in the first section, reducing data to two or three dimensions is often the only way to visually explore its structure, find clusters, and gain human-interpretable insights.
Two Main Approaches
It's also useful to know that there are two broad categories of dimensionality reduction:
- Feature Selection: In this approach, we simply select a subset of the most important original features and discard the rest. Think of it as pruning the irrelevant columns from your data table.
- Feature Extraction: This approach creates entirely new features by finding combinations of the original ones. These new, combined features are designed to summarize the original data efficiently. The new features (dimensions) are no longer directly interpretable as "age" or "income," but are instead abstract components that capture the most important patterns in the data.
The technique we will study next, Principal Component Analysis (PCA), is a prime example of feature extraction.
Conclusion
In this lesson, you've learned the crucial why behind dimensionality reduction. It's not just a mathematical trick; it's a fundamental tool for making machine learning practical and effective in the face of complex, high-dimensional data.
Key Takeaways:
- High-dimensional data (data with many features) is difficult to visualize and can degrade model performance.
- The "Curse of Dimensionality" refers to problems like data sparsity, overfitting, and high computational costs that arise from having too many features.
- The purpose of dimensionality reduction is to reduce the number of features while preserving essential information.
- This serves two primary goals:
- Improving model performance by reducing noise, preventing overfitting, and increasing computational speed.
- Enabling data visualization by projecting the data into a 2D or 3D space.
Preview of the Next Lesson:
We have established why reducing dimensions is so important. In the next lesson, we will begin to explore how it's done. We will introduce Principal Component Analysis (PCA), one of the most widely used feature extraction techniques. You'll learn how it uses concepts from linear algebra to find the new, powerful features that best represent your data.