Introduction
Welcome back! In the previous lesson, you learned the foundational skills of loading data into pandas DataFrames, inspecting its structure, and selecting specific rows and columns using methods like .loc, .iloc, and boolean indexing. You can now slice and dice your data to isolate the pieces you're interested in.
However, analysis rarely stops at just selecting data. To uncover patterns and insights, we need to summarize it. Questions like "What is the average salary for each department?" or "What are the total sales for each product category?" require us to group our data and then apply a calculation. This process is called data aggregation.
In this lesson, you will master the learning outcome: Perform data aggregation on a DataFrame using methods like groupby() and agg(). This is one of the most powerful features in pandas and is central to almost any data analysis task. For your goal of building advanced AI, understanding how to efficiently summarize vast amounts of data is a critical skill for feature engineering, reporting, and exploratory data analysis.
1. The Core Concept: Split-Apply-Combine
Before writing any code, it's crucial to understand the conceptual model behind pandas' grouping operations. This model is called Split-Apply-Combine, a three-step process that allows you to perform complex calculations across different subsets of your data.
Pandas GroupBy Explained: Syntax, Examples, and Tips
Let's start with a theoretical overview. This article from DataCamp clearly explains the three phases of a groupby operation. Understanding this logic is key to mastering data aggregation.
Read the sections "How Does Pandas GroupBy Work?" and "The Split-Apply-Combine Mechanism". Focus on the conceptual descriptions of the three phases: splitting the DataFrame into groups, applying a function to each group, and combining the results.
Here's a breakdown of the three steps:
- Split: The data is partitioned into groups based on some criteria (e.g., all rows with the same 'Country' value go into one group, all rows with another 'Country' value go into a second, and so on).
- Apply: A function is applied independently to each group. This could be a simple aggregation like
sum()ormean(), or a more complex transformation. - Combine: The results of the function applications are collected and combined into a new data structure (like a new DataFrame or Series).
To see this process in action, watch the following short video. It provides an excellent visual walkthrough.
Python Pandas Tutorial 7. Group By (Split Apply Combine)
This video from codebasics offers a clear, animated explanation of the Split-Apply-Combine strategy, making the abstract concept very concrete.
Watch from 02:52 to 03:38 to see how a DataFrame is conceptually split into groups. Then, watch from 05:54 to 08:19 to see the 'Apply' (running .max() or .mean()) and 'Combine' (seeing the final result) steps.
2. Performing GroupBy and Simple Aggregations
Now that you understand the theory, let's apply it. We'll start with some basic aggregations before moving to groupby(). We'll be using a dataset from a developer survey. The primary video for this lesson provides all the code and data.
Python Pandas Tutorial (Part 8): Grouping and Aggregating - Analyzing and Exploring Your Data
The following video by Corey Schafer is a comprehensive guide to grouping and aggregation. We'll watch it in several parts. First, let's see how to perform some simple aggregations on the entire dataset to get a feel for the data.
Watch from 01:12 to 12:39. Pay attention to how methods like .median(), .describe(), .count(), and .value_counts() are used to summarize entire columns (Series). This is a good warm-up for applying these same functions to groups.
As you saw, you can get statistics like the median salary for all developers. But what if you want the median salary per country? This is where groupby() comes in. The syntax is straightforward: you call .groupby() on your DataFrame with the column you want to group by, and then you chain the aggregation function you want to apply.
df.groupby('Country')['ConvertedComp'].median()
Let's continue with the video to see exactly how this works.
Python Pandas Tutorial (Part 8): Grouping and Aggregating - Analyzing and Exploring Your Data
Now, let's see the groupby() method in action. This segment will walk you through creating a GroupBy object and applying simple aggregation functions to it.
Watch from 12:39 to 20:07, and then from 24:33 to 25:56. The first part introduces the .groupby() method and the .get_group() function, which is great for inspecting the split. The second part shows a direct example of calculating the median salary per country.
3. Multiple and Custom Aggregations with .agg()
Simple aggregations like .mean() or .sum() are powerful, but often you need more flexibility. You might want to:
- Apply several aggregation functions at once (e.g., get the mean and median).
- Apply different functions to different columns.
- Rename the output columns for clarity.
This is where the .agg() method shines. It allows you to define your aggregations with precision using a list or a dictionary.
Python Pandas Tutorial (Part 8): Grouping and Aggregating - Analyzing and Exploring Your Data
Let's see how to use the .agg() method to apply multiple aggregation functions simultaneously.
Watch from 25:56 to 27:23. This short clip demonstrates how to pass a list of function names (as strings) to .agg() to get multiple statistics for each group.
The .agg() method is incredibly versatile. Here is a visual summary of its most common uses:
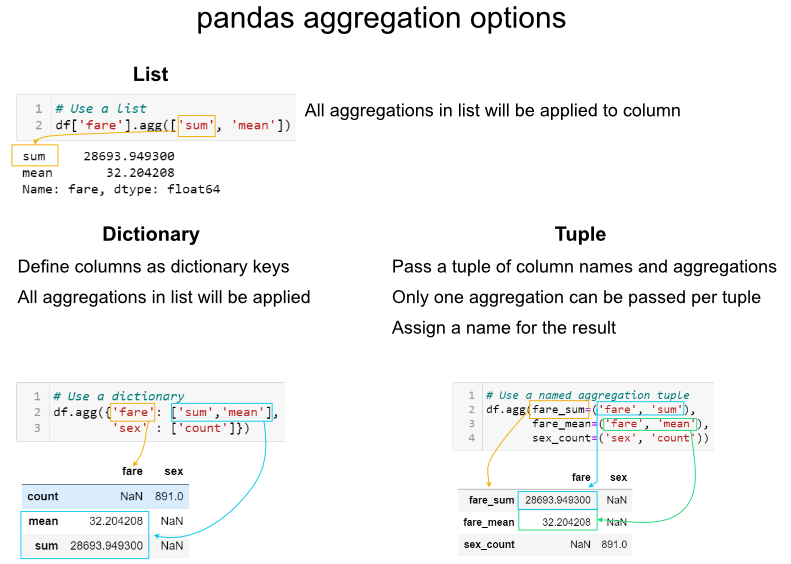
The dictionary method is particularly useful. For example, if you wanted to find the total sales and the average number of units sold per product:
df.groupby('product').agg({
    'sales': 'sum',
    'units': 'mean'
})
4. An Advanced Application: Combining GroupBy, Apply, and Concat
To truly harness the power of pandas for complex analysis, you often need to combine several operations. The next segment of the video walks through a complete, practical example: calculating the percentage of developers in each country who know Python.
This example is more advanced and ties together several concepts:
- Grouping by country.
- Using
.apply()with a customlambdafunction to perform a string search on each group (a task that can't be done with a simple aggregation like.sum()). - Creating two separate summary Series (total respondents per country and Python users per country).
- Combining these Series into a new DataFrame using
pd.concat(). - Performing arithmetic on the columns of the new DataFrame to get the final percentage.
Following this entire workflow will give you a real sense of how data analysis is performed in practice.
Python Pandas Tutorial (Part 8): Grouping and Aggregating - Analyzing and Exploring Your Data
This final, extended clip is a masterclass in applying groupby to a non-trivial problem. It demonstrates how to move beyond simple, built-in aggregations to answer a more nuanced question about your data.
Watch from 27:23 to 45:26. Don't worry if you don't catch every single detail on the first pass. The goal is to understand the logic: why a simple .sum() doesn't work, how .apply() provides a solution, and how the intermediate results are combined to produce the final answer. This is a glimpse into the problem-solving mindset of a data analyst.
Your Turn: Practice Exercise
Let's use the video game sales dataset from our last lesson to practice these new skills.
Task (5-10 minutes):
- Run the code below to load the dataset.
- Find the average
Global_Salesfor eachPublisher. Display the top 5 publishers with the highest average sales. (Hint: you'll need to chain.nlargest(5)after your aggregation). - Group the data by
PlatformandGenre. Find the totalNA_Sales(North American sales) for each combination. - Use the
.agg()method to find the following statistics for eachGenre:- The total
Global_Sales(sum). - The average
EU_Sales(mean). - The number of games released (
Namecolumn, count).
- The total
# 1. Load the dataset
import pandas as pd
url = 'https://gist.githubusercontent.com/gwalker/8568092/raw/bb6ded017a3507973c1143c683fa6d4825595568/vgsales.csv'
df_vgsales = pd.read_csv(url)
Click to see a possible solution
import pandas as pd


# 1. Load the dataset
url = 'https://gist.githubusercontent.com/gwalker/8568092/raw/bb6ded017a3507973c1143c683fa6d4825595568/vgsales.csv'
df_vgsales = pd.read_csv(url)


# 2. Find the average Global_Sales per Publisher and display the top 5
avg_sales_by_publisher = df_vgsales.groupby('Publisher')['Global_Sales'].mean()
top_5_publishers = avg_sales_by_publisher.nlargest(5)
print("--- Top 5 Publishers by Average Global Sales ---")
print(top_5_publishers)


# 3. Group by Platform and Genre, find total NA_Sales
na_sales_by_platform_genre = df_vgsales.groupby(['Platform', 'Genre'])['NA_Sales'].sum()
print("\n--- Total NA Sales by Platform and Genre (first 10) ---")
print(na_sales_by_platform_genre.head(10))


# 4. Use .agg() to get multiple stats for each Genre
genre_stats = df_vgsales.groupby('Genre').agg(
    Total_Global_Sales=('Global_Sales', 'sum'),
    Average_EU_Sales=('EU_Sales', 'mean'),
    Number_of_Games=('Name', 'count')
)
print("\n--- Comprehensive Statistics by Genre ---")
print(genre_stats)
Conclusion
Excellent work. You've now unlocked one of the most essential and powerful capabilities in the pandas library. Being able to group data and compute summary statistics is the foundation of data analysis and feature engineering.
Key Takeaways:
- Split-Apply-Combine is the fundamental paradigm for
groupbyoperations. - You can apply simple aggregations like
.mean(),.sum(), and.count()to grouped data to quickly generate insights. - The
.agg()method provides maximum flexibility, allowing you to apply multiple functions, target different columns, and name your results clearly. - Complex analytical questions can be answered by chaining
groupbywith other pandas methods like.apply()and.concat().
Preview of the Next Lesson:
Now that you can extract and summarize meaningful statistics from your data, what's the next logical step? Visualizing them! A table showing average sales per country is useful, but a bar chart of that same data is instantly understandable. In our next lesson, "Create basic plots (line, scatter, histogram) using Matplotlib," you will learn how to turn your aggregated data into insightful charts and graphs. This will bring your data analysis to life and allow you to communicate your findings effectively.