In our previous lesson, we built the engine's "heartbeat": a fixed-timestep loop that decouples the physics simulation from the rendering framerate. This ensures stability and determinism, but so far, our simulation is invisible. To build and debug a complex system like a physics engine, we need to see what it's doing.
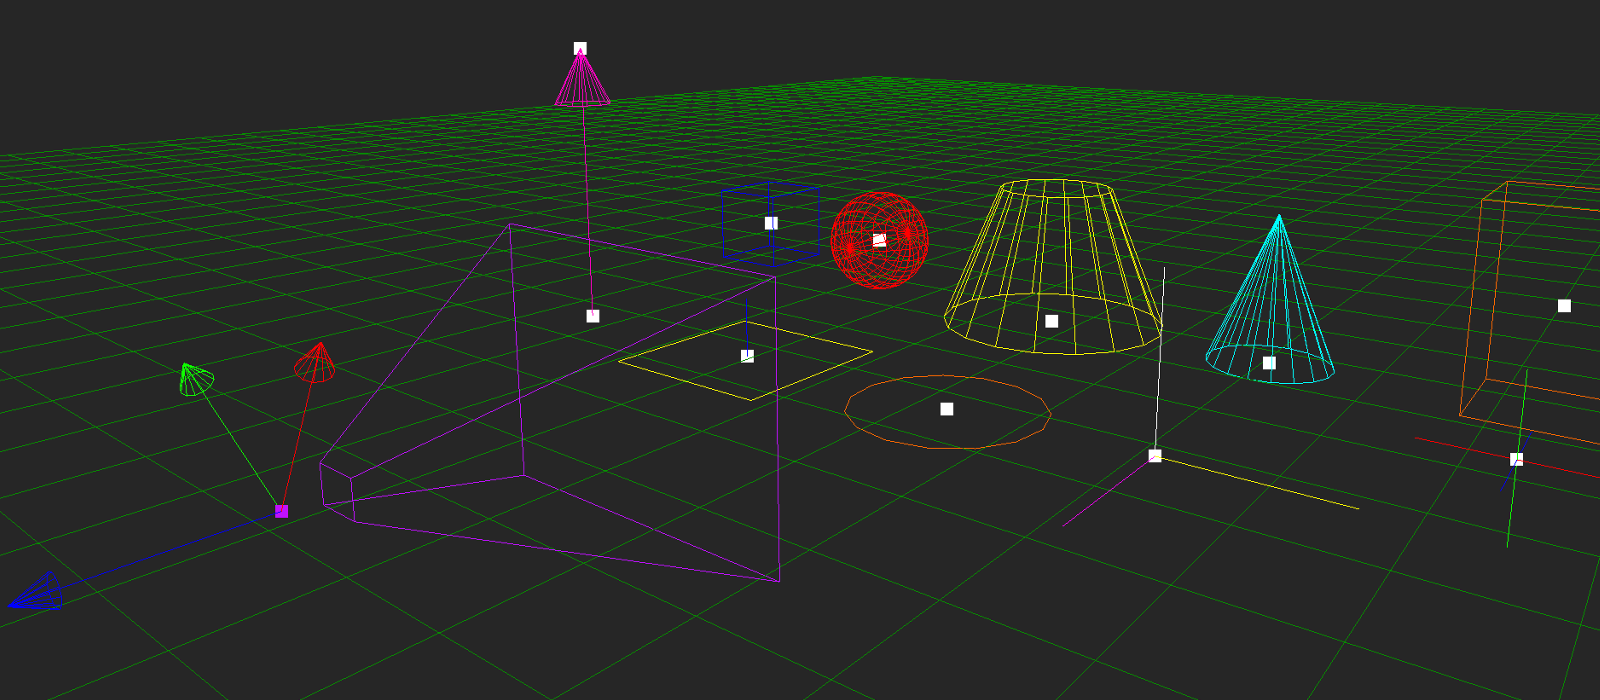
This lesson addresses that need directly. We will set up a basic debug-drawing system. This is an indispensable tool that allows us to render simple shapes like lines, points, and coordinate axes to visualize abstract data such as velocities, forces, collision volumes, and contact points. Your experience with OpenGL will be a significant asset here, as we'll be working with its core components to create a flexible and efficient visualization layer for our engine.
The Indispensable Role of Visual Feedback
Developing a physics engine often involves debugging situations that are difficult to reason about with numbers alone. Is a collision detection algorithm failing? Is an object's orientation being calculated correctly? Is a constraint pulling in the right direction? Without a visual representation, answering these questions is a monumental task.
Let's watch a short segment from a video by The Cherno that perfectly illustrates why visualizing physics components is not just a convenience, but a necessity.
Visualizing Physics Colliders // Game Engine series
This video, "Visualizing Physics Colliders," makes a strong case for the importance of debug rendering in a game engine.
Watch the introduction from the beginning up to this point. The presenter demonstrates the difficulty of tuning physics parameters without seeing the collider shapes, which highlights the problem we are about to solve.
As the video shows, a debug-drawing system provides a direct window into the state of the simulation, making it immeasurably easier to build, verify, and refine the engine's subsystems.
The Modern OpenGL Rendering Pipeline
Given your experience with OpenGL, we'll move swiftly through the setup, focusing on how the pieces connect to form our debug renderer. A modern OpenGL application for this purpose requires three main ingredients:
- Vertex Data: We need to send the geometry (the points that make up our lines) to the GPU. This is done by creating a Vertex Buffer Object (VBO) to store the data and a Vertex Array Object (VAO) to describe the data's layout (e.g., "each vertex has a 3-component position and a 4-component color").
- Shaders: We must provide small programs that run on the GPU to process our vertices. A vertex shader positions the vertices, and a fragment shader determines the final color of each pixel. For debug drawing, these can be extremely simple.
- Draw Calls: With the data and shaders in place, we instruct the GPU to render the geometry using a command like
glDrawArrays.
A well-structured article by Clark Kromenaker, "Basic 3D Rendering," walks through creating these components in C++. While you are already familiar with these concepts, this resource serves as an excellent, concise refresher and provides a clear C++ implementation structure that we can adapt.
G-Engine #4: Basic 3D Rendering - Clark Kromenaker
This article provides a clean, class-based C++ implementation for setting up a basic OpenGL rendering pipeline. We'll use its structure as a guide.
Please read the following sections to refamiliarize yourself with the core objects: Defining Vertex Data: This section introduces the concept of representing geometry as an array of floats. Loading Vertex Data for OpenGL: This is the most crucial part. Review how to create a VertexArray class that encapsulates a VBO and a VAO, and how glVertexAttribPointer is used to describe the vertex layout. Writing a Shader: Read through the explanation of vertex and fragment shaders and review the simple GLSL code provided. Loading a Shader: Skim this section to see how shader source files are loaded, compiled, and linked into a shader program.
Your first task is to set up this basic infrastructure. You should have:
- A window and an OpenGL 3.3+ Core profile context (using a library like SDL, GLFW, or your preferred equivalent).
- A
Shaderclass capable of loading, compiling, and activating a simple vertex and fragment shader. - A
VertexArrayclass that can take vertex data, create the VBO and VAO, and be drawn.
Drawing Lines with a Batch Renderer
The most fundamental primitive for debug drawing is the line. Bounding boxes, velocity vectors, and contact normals are all rendered as lines. While OpenGL can draw triangles efficiently, it also has native support for drawing lines.
A naive approach would be to make a separate draw call for every single line we want to render. This is extremely inefficient. A much better approach is to batch them. We collect all the lines we want to draw for a given frame in a CPU-side buffer and then send them all to the GPU in a single draw call.
The Cherno provides another excellent, practical video that details exactly how to build such a system.
Rendering Lines in a Game Engine // Game Engine series
This video, "Rendering Lines in a Game Engine," walks through the process of creating a dedicated batch renderer for lines.
Watch from this segment to understand the different line-drawing primitives in OpenGL (GL_LINES, GL_LINE_STRIP) and why we'll use a simple glDrawArrays approach with GL_LINES. Continue from this part, which shows how to modify the rendering API to include a DrawLines function using glDrawArrays. The core implementation of the batcher is covered from here. Pay close attention to how a LineVertex struct is defined and how the vertex buffer pointer is managed. Finally, observe the creation of a simple line shader and the implementation of a DrawLine API function from this part.
Following the pattern from the video, you should implement a line-batching system. The key components will be:
-
A
LineVertexstruct:struct LineVertex { // 3D position float x, y, z; // Color float r, g, b, a; }; -
A dedicated VAO and a large, dynamic VBO for the line vertices.
-
A simple line shader. The vertex shader will take the position and pass it through a transformation matrix (for camera projection, which we'll add soon). The fragment shader will simply output the vertex color.
-
An immediate-mode style API:
void BeginLines(): Resets the buffer for a new frame.void DrawLine(const Vec3& p0, const Vec3& p1, const Color& color): Adds twoLineVertexinstances to a CPU-side buffer.void EndLines(): Submits the batch of vertex data from the CPU buffer to the GPU's VBO and makes theglDrawArrays(GL_LINES, ...)call.
Drawing Transforms
One of the most useful debug visualizations is the transform, or local coordinate system, of an object. This is typically drawn as three orthogonal, colored lines originating from the object's position, representing its local X, Y, and Z axes. This is often called an axis triad.

With your DrawLine function, creating a function to draw a transform is straightforward.
void DrawTransform(const Mat4& transform) {
    // Extract the origin and axes from the transformation matrix
    Vec3 origin = transform.GetTranslation();
    Vec3 xAxis = transform.GetXAxis();
    Vec3 yAxis = transform.GetYAxis();
    Vec3 zAxis = transform.GetZAxis();

    // Draw the axes
    DrawLine(origin, origin + xAxis, Color::Red);
    DrawLine(origin, origin + yAxis, Color::Green);
    DrawLine(origin, origin + zAxis, Color::Blue);
}
(Note: The Vec3, Mat4, and Color types are placeholders. We will implement our own math library in the next lesson.)
Integration into the Main Loop
Finally, let's place our debug drawing calls into the engine loop we created in the last lesson. The ideal place for debug rendering is as an overlay, drawn after the main scene but before the buffers are swapped. This keeps the logic separate and allows it to be easily toggled.
// Inside your main loop
while (running) {
    // ... (accumulator logic for fixed-step physics update) ...

    // --- Rendering ---

    // 1. Clear the screen
    glClear(GL_COLOR_BUFFER_BIT | GL_DEPTH_BUFFER_BIT);

    // 2. Setup camera projection (we will detail this later)

    // 3. Render the main scene (currently empty)
    // render_scene();

    // 4. Render debug visuals
    BeginLines();

    // Example: Draw a grid, a transform at the origin, etc.
    DrawTransform(Mat4::Identity());
    // ... other DrawLine calls ...

    EndLines();

    // 5. Swap buffers
    SDL_GL_SwapWindow(mWindow);
}
The video "Visualizing Physics Colliders" also discusses this architectural choice of an overlay pass. You can watch the segment from
Conclusion
In this lesson, we have laid the groundwork for one of the most critical tools in physics engine development. By setting up a system to render simple primitives, we've given ourselves the ability to "see" the abstract data that drives the simulation. This visual feedback loop will be invaluable as we move on to more complex topics.
Key Takeaways:
- Debug drawing is essential for developing, debugging, and tuning a physics engine.
- A modern OpenGL renderer is built upon VBOs/VAOs to manage geometry data and shaders to process it on the GPU.
- For efficiency, debug primitives like lines should be batched and drawn in a single draw call per frame.
- An immediate-mode API (
Begin,Draw,End) provides a simple and flexible way to add debug visuals from anywhere in the code. - Common debug visuals include lines for vectors and forces, and axis triads for transforms.
In our next lesson, we will begin building our own 3D vector and matrix math library. The debug drawing system you've just created will be put to immediate use, allowing us to visualize the vectors and transformations we implement.