Hello! Welcome to your first lesson on Pandas, the most powerful and widely used library for data manipulation in Python.
In the previous module, we mastered NumPy and the concept of vectorization. You learned how to perform fast, array-oriented computations, which is a crucial skill. However, real-world data is rarely just a clean matrix of numbers. It comes with labels, mixed data types (numbers, text, dates), and missing values. This is where Pandas comes in.
This lesson introduces the two fundamental data structures in Pandas: the Series and the DataFrame. We'll explore what they are and, most importantly, how to create them from various common data sources, like Python lists, dictionaries, and external files. This is the first step towards using Pandas for any data analysis or machine learning task.
1. Why Pandas? From NumPy Arrays to DataFrames
You might be wondering: if we have NumPy, why do we need another library? NumPy arrays are fantastic for fast numerical computation, but they have two main limitations for data analysis:
- Homogeneous Data: All elements in a NumPy array must be of the same data type. Real-world datasets often have columns of different types (e.g., a text column for names, a numeric column for age, a boolean for status).
- Implicit Indexing: You access data using integer indices (
array[0],array[5, 2]). It's up to you to remember that column0is 'age' and column1is 'income'. This becomes difficult with many columns.
Pandas is built on top of NumPy to solve exactly these problems. It introduces data structures with explicit labels for rows and columns, and it handles columns of different data types gracefully.
The following video provides an excellent introduction to why Pandas is necessary for practical data analysis.
Pandas Full Course (2025) | Python Pandas Tutorial For Beginners | Python Pandas Course |Intellipaat
First, let's understand why we need Pandas when we already have NumPy. This video gives a great explanation by comparing a NumPy array representation of data to a more intuitive tabular format.
Watch the first 2 minutes and 45 seconds (00:00 - 02:44). Notice the problem the presenter highlights: a NumPy array lacks column labels, making it hard to interpret the data.
2. The Core Data Structures: Series and DataFrame
Pandas has two main data structures you'll use constantly:
Series: A one-dimensional labeled array, similar to a single column in a spreadsheet. It wraps a NumPy array and adds an index, which is a set of labels for each element.DataFrame: A two-dimensional labeled data structure with columns of potentially different types. You can think of it as a spreadsheet, a SQL table, or, most accurately, a dictionary ofSeriesobjects that all share the same index.
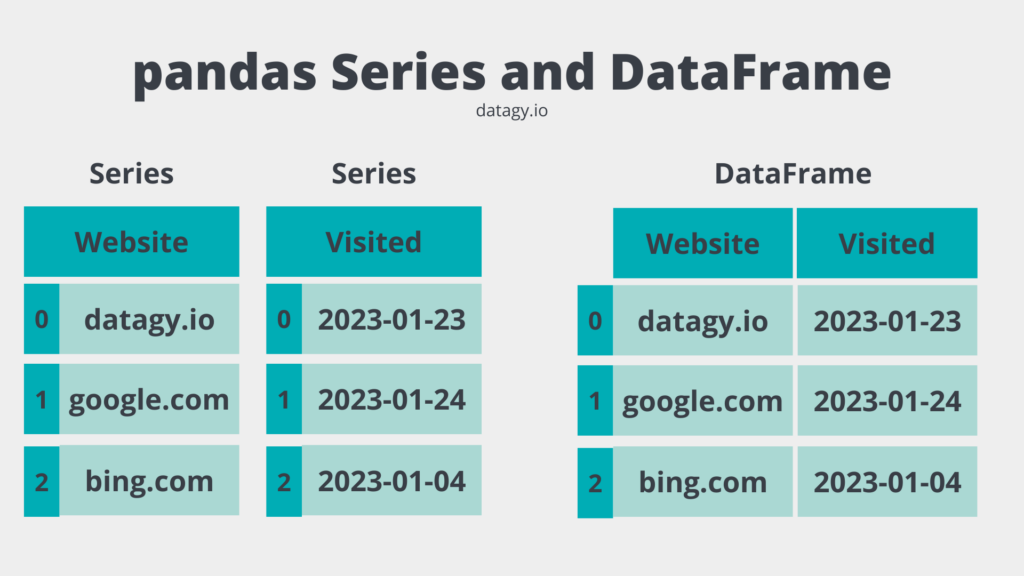
The next video segment clearly defines these two structures and their properties.
Pandas Full Course (2025) | Python Pandas Tutorial For Beginners | Python Pandas Course |Intellipaat
This segment of the video defines the one-dimensional Series and the two-dimensional DataFrame and explains their key properties.
Watch from 05:29 to 09:16. Focus on the distinction between a Series (1D, homogeneous type, size-immutable) and a DataFrame (2D, heterogeneous types, size-mutable).
3. Creating a Pandas Series
A Series is the building block of a DataFrame. You create one using the pd.Series() constructor. The two most important arguments are data and index.
Let's dive into creating our first Pandas object, the Series. This reading from Practical Data Science provides a clear, step-by-step guide.
Read the sections 'What is a Series?', 'Creating a series', and 'Indices'. This will show you how a Series is similar to a NumPy array but with the crucial addition of a custom index.
Here are the most common ways to create a Series:
From a Python List
If you only provide a list, Pandas automatically creates an integer index from 0.
import pandas as pd
import numpy as np

# A Series of student grades
grades = pd.Series([85, 92, 78, 95])
print(grades)
Output:
0    85
1    92
2    78
3    95
dtype: int64
You can also provide a custom index.
grades = pd.Series([85, 92, 78, 95], index=['Alice', 'Bob', 'Charlie', 'David'])
print(grades)
Output:
Alice      85
Bob        92
Charlie    78
David      95
dtype: int64
From a Python Dictionary
When you create a Series from a dictionary, Pandas uses the dictionary keys as the index and the values as the data. This is often very convenient.
student_ages = {'Alice': 21, 'Bob': 22, 'Charlie': 21}
age_series = pd.Series(student_ages)
print(age_series)
Output:
Alice      21
Bob        22
Charlie    21
dtype: int64
Test your understanding!
Create a Pandas Series named book_prices that contains the prices of three books: "Data Science from Scratch" at $25.50, "Python for Data Analysis" at $30.00, and "Deep Learning" at $35.75. The book titles should be the index.
Show answer
You can do this directly from a dictionary, which is the most straightforward way.
import pandas as pd

prices_dict = {
    "Data Science from Scratch": 25.50,
    "Python for Data Analysis": 30.00,
    "Deep Learning": 35.75
}

book_prices = pd.Series(prices_dict)
print(book_prices)
4. Creating a Pandas DataFrame
The DataFrame is the primary object you'll work with. It's a versatile structure that can be created from many different kinds of data. The following video gives a great practical overview of the most common methods.
Python Pandas Tutorial 3: Different Ways Of Creating DataFrame
Now for the DataFrame. This is the object you'll use most in Pandas. The following video by 'codebasics' demonstrates five common ways to create a DataFrame.
Watch the video from 00:45 to 06:33. It covers creating DataFrames from: A CSV file (read_csv) An Excel file (read_excel) A Python dictionary (column-oriented) A list of tuples A list of dictionaries (row-oriented)
Let's review the main in-memory methods shown in the video.
From a Dictionary of Lists (Column-Oriented)
This is arguably the most common way to create a DataFrame from scratch. Each key becomes a column name, and the list associated with it becomes the data for that column. Since you have a CS background, you can think of this as a hash map where keys are column labels and values are the column vectors.
data = {
    'Student': ['Alice', 'Bob', 'Charlie', 'David'],
    'Grade': [85, 92, 78, 95],
    'Major': ['CS', 'Math', 'CS', 'Physics']
}

df = pd.DataFrame(data)
print(df)
Output:
   Student  Grade    Major
0    Alice     85       CS
1      Bob     92     Math
2  Charlie     78       CS
3    David     95  Physics
From a List of Dictionaries (Row-Oriented)
This is another popular method, especially when your data is generated record by record (e.g., from a JSON file or an API). Each dictionary in the list represents a single row.
data = [
    {'Student': 'Alice', 'Grade': 85, 'Major': 'CS'},
    {'Student': 'Bob', 'Grade': 92, 'Major': 'Math'},
    {'Student': 'Charlie', 'Grade': 78, 'Major': 'CS'},
    # Notice this record is missing the 'Major'
    {'Student': 'Eve', 'Grade': 88}
]

df = pd.DataFrame(data)
print(df)
Output:
   Student  Grade Major
0    Alice     85    CS
1      Bob     92  Math
2  Charlie     78    CS
3      Eve     88   NaN
Notice how Pandas automatically handles the missing 'Major' for Eve, filling it with NaN (Not a Number), its standard marker for missing data.
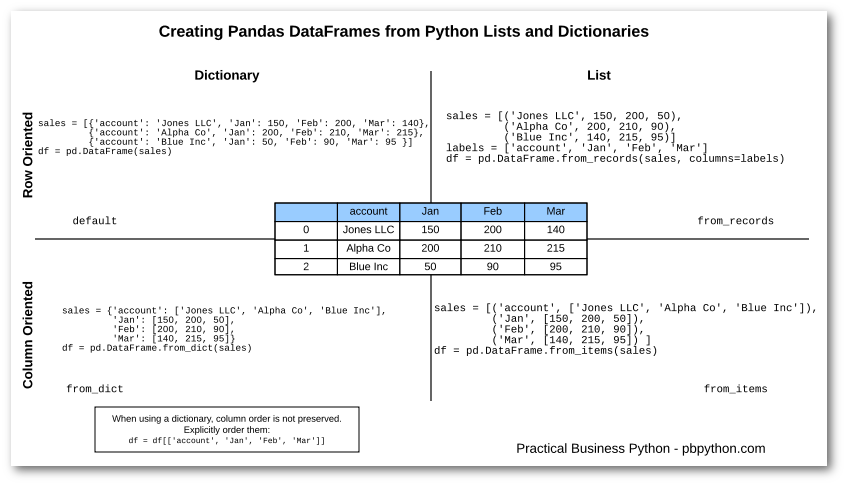
This image provides a great visual summary of the different ways to create a DataFrame from Python objects.
From External Files
In practice, you will most often create DataFrames by reading data from files. Pandas has highly optimized readers for various formats. The most common is pd.read_csv().
Let's assume you have a file named weather.csv with the following content:
day,temperature,windspeed,event
1/1/2017,32,6,Rain
1/2/2017,35,7,Sunny
1/3/2017,28,2,Snow
You can load it into a DataFrame with a single command:
# This assumes 'weather.csv' is in the same directory
# You would replace 'weather.csv' with the actual path to your file.
df_from_csv = pd.read_csv('weather.csv')
print(df_from_csv)
Output:
        day  temperature  windspeed  event
0  1/1/2017           32          6   Rain
1  1/2/2017           35          7  Sunny
2  1/3/2017           28          2   Snow
For more details on all the possible ways to create a DataFrame, you can skim the official documentation.
Intro to data structures — pandas 3.0.0 documentation
For a comprehensive look at all the ways you can create a DataFrame, the official Pandas documentation is the ultimate resource. We've covered the most important methods, but this is here for your reference.
Skim the section 'DataFrame'. Pay particular attention to the subsections 'From dict of ndarrays / lists' and 'From a list of dicts', as these correspond to what we've just discussed.
Conclusion
In this lesson, we made the transition from NumPy's array-centric world to Pandas' data-centric paradigm. You now have a solid foundation for the rest of this module and your future work in data science.
Key Takeaways:
- Pandas extends NumPy by adding explicit labels (indexes and columns) and the ability to handle columns with different data types.
- The
Seriesis a 1D labeled array, representing a single column of data. - The
DataFrameis a 2D labeled table, representing an entire dataset. It can be seen as a collection ofSeries. - You can create these objects from various in-memory structures like dictionaries and lists, with the choice of method often depending on whether your data is organized by columns or by rows.
- The most common real-world method for creating a
DataFrameis by reading from a file, using functions likepd.read_csv().
Preview of the Next Lesson:
Now that you know how to create Series and DataFrame objects, the next logical step is to learn how to interact with them. In the next lesson, we will cover how to inspect the properties of a DataFrame (like its shape, data types, and first few rows) and how to select specific rows, columns, and individual cells using various indexing techniques.