Hello! Welcome to your next lesson in the Data Manipulation with Pandas module.
In our last session, we focused on transforming data and creating new columns using methods like .apply() and vectorized operations. A common side effect of data manipulation, or an issue with raw data itself, is the presence of missing values, often represented as NaN (Not a Number) in Pandas. Leaving these in your dataset can cause your analysis to fail or, worse, lead to incorrect conclusions.
Today, we will tackle this problem head-on. This lesson covers the crucial skill of handling missing data using various removal and imputation strategies. Your learning outcome is to be able to handle missing data using imputation and removal strategies. This is a non-negotiable step in any data science workflow and is fundamental to preparing a clean, reliable dataset for machine learning.
1. The Nature of Missing Data
Before we jump into the code, it's important to understand why data might be missing. The reason can influence which strategy you choose.
Top Techniques to Handle Missing Values Every Data Scientist Should Know
This article from DataCamp provides an excellent theoretical foundation by categorizing missing data. Understanding these categories helps you reason about the best way to handle them.
Read the introductory part and the section "Types of missing data". Focus on understanding the difference between MCAR, MAR, and MNAR. You don't need to memorize the acronyms, but grasp the core idea behind each.
In short:
- Missing Completely at Random (MCAR): The missingness is random and has no connection to any other data. This is the ideal scenario.
- Missing at Random (MAR): The missingness is related to another variable in the dataset, but not the missing value itself.
- Missing Not at Random (MNAR): The missingness is related to the value that is missing. This is the trickiest to handle as it can introduce significant bias.
This flowchart provides a great mental model for the process we'll follow today, from identification to choosing a solution.

2. Finding the Gaps: Identifying Missing Data
Your first step is always to identify where and how much data is missing. Pandas gives you simple and effective tools for this.
Pandas Missing Values | Python Pandas Tutorial #6 | Pandas Dropna, Fillna, Impute Missing Values
This video from datagy gets straight to the point, showing the most common methods to count missing values in a DataFrame.
Watch from 01:29 to 02:55. Pay close attention to the use of .info() for a high-level overview and the .isna().sum() chain for a precise count of missing values in each column.
To summarize, df.info() gives you a count of non-null values, while df.isna().sum() (or its alias df.isnull().sum()) gives you a direct count of null (NaN) values for each column. The latter is typically the most direct way to assess the extent of the problem.
3. Strategy 1: Removal (Dropping Data)
The simplest strategy is to remove the rows or columns that contain missing data. This is often a good choice if the amount of missing data is very small and randomly distributed (MCAR), as the loss of information will be minimal.
Dropping Rows
By default, .dropna() removes any row containing at least one NaN value.
Dropping Columns
You can also remove entire columns if they are not critical to your analysis and contain a large number of missing values. You do this with the axis=1 parameter.
Pandas Missing Values | Python Pandas Tutorial #6 | Pandas Dropna, Fillna, Impute Missing Values
Let's continue with the datagy video, which demonstrates the .dropna() method and its most important parameters.
Watch from 02:55 to 06:15. This section covers the core functionality of dropna(), including dropping rows with any missing value, using the subset parameter to target specific columns, and the how='all' parameter to drop rows only if all values are missing.
Another very useful parameter is thresh, which lets you specify the minimum number of non-missing values a row must have to be kept.
Python Pandas Tutorial 5: Handle Missing Data: fillna, dropna, interpolate
The codebasics channel provides another excellent tutorial that covers the thresh parameter, giving you more fine-grained control over which rows to drop.
Watch from 16:41 to 19:10. This part explains how to use how='all' and, more importantly, thresh to keep rows that have at least a certain number of valid data points.
Pros and Cons of Removal
- Pro: Simple and effective if the proportion of missing data is small.
- Con: Can lead to significant information loss if many rows are dropped, potentially introducing bias into your dataset.
Test your understanding!
You have the following DataFrame df:
import pandas as pd
import numpy as np

df = pd.DataFrame({
    'A': [1, 2, np.nan, 4],
    'B': [5, np.nan, 7, 8],
    'C': [9, 10, 11, np.nan],
    'D': [np.nan, np.nan, np.nan, np.nan]
})
- Which command would drop only the row at index 3?
- Which command would drop the entire column 'D'?
- Which command would drop the rows at index 1 and 2, but keep the row at index 0 and 3? (Think about the
threshparameter).
Show answer
df.dropna(subset=['C'])would drop the row at index 3, as it's the only one with aNaNin column 'C'.df.dropna(axis=1, how='all')would drop column 'D' because all its values areNaN.df.dropna(thresh=2)would keep rows with at least 2 non-missing values. Row 0 has 3, row 3 has 1. Rows 1 and 2 each have 2 valid values. So, let's refine:df.dropna(thresh=3)would drop rows 1, 2 and 3, keeping only row 0. To drop just 1 and 2, you could usedf.drop([1, 2]). The question was designed to make you think aboutthresh's logic! A more directthreshapproach might not work for this specific case, showing the limits of a single method.
4. Strategy 2: Imputation (Filling Data)
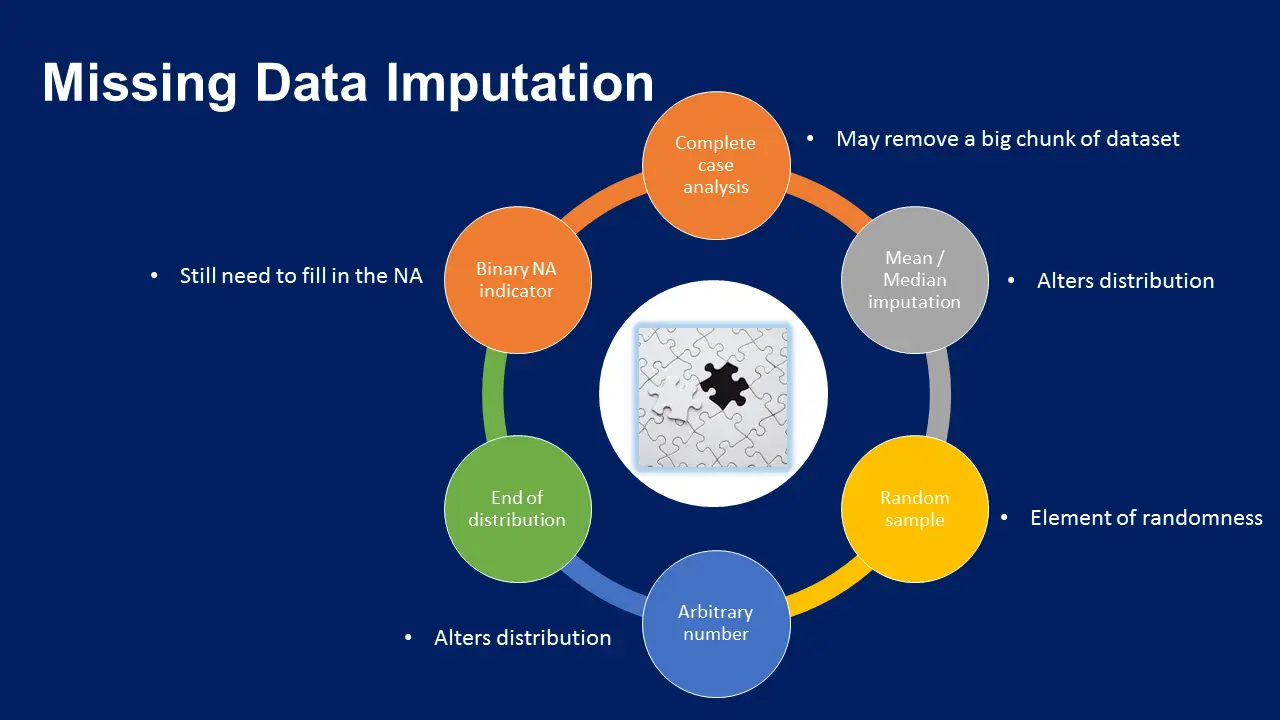
Instead of deleting data, we can fill in the blanks. This is called imputation. The challenge is to fill the missing values with reasonable estimates without distorting the data's original distribution.
Simple Imputation Methods
These are straightforward and widely used for their simplicity. The main function is .fillna().
- Filling with a Constant: You can replace
NaNwith0for numerical data or a string like "Unknown" for categorical data. This is useful when the absence of a value is meaningful in itself. - Filling with a Statistic (Mean/Median/Mode):
- Mean: Good for numerical columns that are roughly normally distributed. Sensitive to outliers.
- Median: Better for numerical columns with outliers or a skewed distribution.
- Mode: Used for categorical (string) columns.
- Forward Fill and Backward Fill (
ffill,bfill): This propagates the last valid observation forward or the next valid observation backward. It's especially useful for time-series data where values are likely to be similar to the preceding or following ones.
Pandas Missing Values | Python Pandas Tutorial #6 | Pandas Dropna, Fillna, Impute Missing Values
This video from datagy provides a comprehensive walkthrough of the .fillna() method, covering all the simple imputation strategies mentioned above.
Watch from 06:15 to 12:22. This section demonstrates filling with a constant value, using a dictionary to fill different columns differently, filling with the column mean, and using forward fill (ffill) and backward fill (bfill), including the limit parameter.
Advanced Imputation: Interpolation
Interpolation is a more sophisticated way to estimate missing values, particularly for numerical or time-series data. Instead of just copying a value, it estimates a value that lies between other data points. Linear interpolation, for example, draws a straight line between the points before and after the gap and picks the value on that line.
Your CS and math background will help you appreciate this. It's like finding a point on a line given two other points—a more "intelligent" guess than just taking the average of the whole dataset.
Python Pandas Tutorial 5: Handle Missing Data: fillna, dropna, interpolate
The codebasics video has an excellent segment on interpolation, including a very powerful time-based method.
Watch from 13:01 to 16:41. Notice how interpolate() provides a more reasonable guess for the missing temperature than a simple ffill. Pay special attention to the method='time' argument, which makes the interpolation aware of the time index, providing an even better estimate.
Assessing the Impact of Imputation
Crucially, you must be aware that imputation changes your data. A good imputation strategy preserves the original statistical distribution of the data as much as possible. A poor one can distort it.
Top Techniques to Handle Missing Values Every Data Scientist Should Know
The DataCamp article we saw earlier has a fantastic visual comparison of how different imputation methods affect a variable's distribution.
First, read the section "Mean/Median Imputation" and its pros/cons. Then, jump to the section with the distribution plots (it starts with "From all the imputations, it is possible to identify...") and look at the plots titled '“Charge Amount” distribution'. See how the mean and median imputations distort the original distribution, while more advanced methods can preserve it.
This visual check is a powerful tool to validate your imputation strategy. If the shape of your data's distribution changes drastically after filling in values, you may be introducing significant bias.
Conclusion
You have now learned the essential strategies for handling missing data in Pandas, a critical skill for any data scientist or machine learning practitioner.
Key Takeaways:
- Identify First: Always start by using
.isna().sum()to understand the scope of your missing data problem. - Removal (
.dropna()): A simple and fast method, but best used when the amount of missing data is small to avoid significant information loss. - Imputation (
.fillna(),.interpolate()): A more common approach where you fill in missing values. The choice of method is critical:- Mean/Median/Mode: Simple statistical fills. Use Median if outliers are present.
- Forward/Backward Fill: Excellent for ordered or time-series data.
- Interpolation: A more sophisticated guess for numerical data that often yields better results.
- No Perfect Solution: Every method has trade-offs. The goal is to choose the one that makes the most sense for your specific data and problem, and which introduces the least amount of distortion.
Preview of the Next Lesson:
This lesson marks the end of our core Pandas module. You've built a strong foundation in loading, inspecting, filtering, sorting, transforming, and now cleaning data. In our next module, "Data Visualization and Preparation," we will begin to explore our data visually. Our first lesson will focus on creating basic plots like line charts, scatter plots, and histograms using Matplotlib, allowing you to see the patterns and distributions in the data you've worked so hard to prepare.