Hello! Welcome back to our course on Python for Machine Learning.
In the last lesson, we wrapped up our discussion on data cleaning by learning how to handle missing values with methods like .dropna(), .fillna(), and .interpolate(). Now that you know how to prepare a clean dataset, we can move on to one of the most powerful and common tasks in data analysis: summarizing data.
Today's lesson addresses the learning outcome: Group data and compute aggregate statistics. This skill is the cornerstone of exploratory data analysis. It allows you to move beyond looking at individual data points and start answering meaningful questions by calculating summary statistics across different segments of your data. For example, "What is the median salary for software developers in different countries?" or "Which product category has the highest average sales?".
We'll explore the fundamental "Split-Apply-Combine" strategy, which is the mental model for all grouping operations in Pandas.
The "Split-Apply-Combine" Strategy
Before we write any code, it's crucial to understand the three-step process that powers all grouping operations.
Aggregation and Grouping | Python Data Science Handbook
This section from the "Python Data Science Handbook" by Jake VanderPlas provides the best conceptual explanation of the groupby operation. Understanding this model will make the code much more intuitive.
Read the section titled "GroupBy: Split, Apply, Combine", focusing on the sub-section "Split, apply, combine". Pay close attention to the diagram and the explanation of the three steps.
This diagram visually represents the strategy:
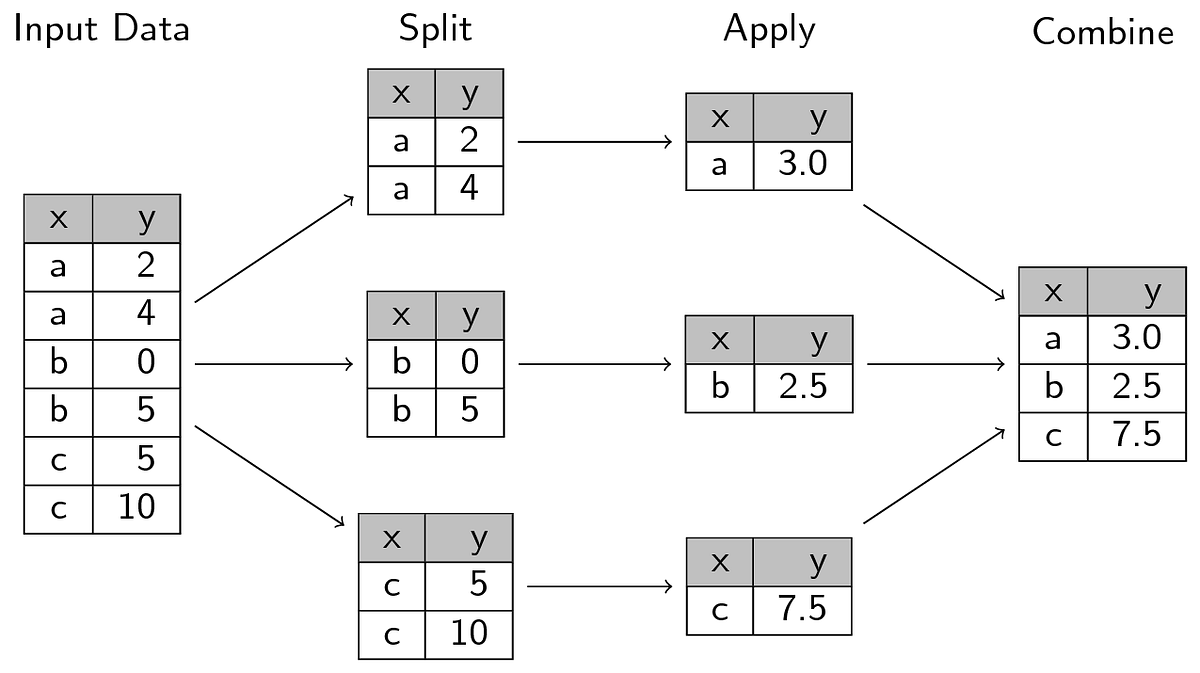
In essence:
- Split: The data is broken into groups based on the unique values in one or more specified columns (the "key").
- Apply: A function (an aggregation) is applied to each group. This could be a simple sum, mean, or a more complex custom function.
- Combine: The results from applying the function to each group are collected and combined into a new DataFrame or Series.
1. Simple Aggregations
Let's start with the "Apply" step in its simplest form: applying an aggregation to an entire DataFrame or Series, without any grouping. You've seen some of this before with NumPy, and it works similarly in Pandas.
Python Pandas Tutorial (Part 8): Grouping and Aggregating - Analyzing and Exploring Your Data
This video by Corey Schafer uses a real-world developer survey dataset to demonstrate basic aggregations. It's a great warm-up before we introduce grouping.
Watch from 01:12 to 05:25. This part covers running simple aggregations like .median() on a Series and .describe() on an entire DataFrame to get a quick statistical summary.
Key takeaways from the video:
- You can call aggregation methods like
.sum(),.mean(), and.median()directly on a Series (a column). - The
.describe()method is an incredibly useful shortcut that computes several common aggregates (count, mean, standard deviation, min, max, and percentiles) for all numerical columns in a DataFrame at once.
2. Grouping and Aggregating
Now, let's combine the "Split" and "Apply" steps. We'll use the .groupby() method to split our DataFrame and then apply an aggregation.
Python Pandas Tutorial (Part 8): Grouping and Aggregating - Analyzing and Exploring Your Data
Let's return to Corey Schafer's tutorial. He provides a crystal-clear explanation of what the .groupby() object is and how to apply functions to it.
Watch from 12:50 to 18:21. Pay attention to how creating a groupby object doesn't immediately show the groups (it's a 'lazy' operation). The .get_group() method is shown as a way to inspect a single group, which makes the 'split' step very tangible.
As you saw, calling df.groupby('Country') creates a DataFrameGroupBy object. This object holds all the information needed to iterate through the groups, but no computation happens until you call an aggregation function.
Let's see this in action. The real power comes when you chain an aggregation to the groupby call.
# First, create the GroupBy object
country_group = df.groupby('Country')

# Now, apply an aggregation to a specific column for all groups
median_salary_by_country = country_group['ConvertedComp'].median()
print(median_salary_by_country)
This single line of code performs the full Split-Apply-Combine process:
- Split: It groups the DataFrame by the 'Country' column.
- Apply: It calculates the
.median()of the 'ConvertedComp' column for each country group. - Combine: It combines the results into a new Series where the index is the country name and the values are the median salaries.
3. Applying Multiple Aggregations with .agg()
What if you want to see the median, mean, and count for each country? Chaining them one by one would be inefficient. This is where the .agg() method comes in. It allows you to apply multiple aggregation functions at once.
Python Pandas Tutorial (Part 8): Grouping and Aggregating - Analyzing and Exploring Your Data
Corey Schafer demonstrates how to use .agg() to run multiple aggregations simultaneously.
Watch from 24:33 to 27:23. This section covers calculating the median salary by country (as we just did) and then introduces .agg() to calculate both the median and mean in a single operation.
You can use .agg() in two primary ways:
-
Pass a list of functions: To apply the same set of aggregations to the selected column(s).
country_group['ConvertedComp'].agg(['median', 'mean']) -
Pass a dictionary: To apply specific aggregations to specific columns. This is extremely powerful.
df.groupby('Country').agg({
    'ConvertedComp': 'median',
    'Age': 'mean'
})
Test your understanding!
Using the developer survey dataset from the video, write a single line of code to find the median salary (ConvertedComp) and the average years of coding experience (YearsCode) for each EdLevel (Education Level) group.
Show answer
# Assuming 'df' is the DataFrame with the survey data
df.groupby('EdLevel').agg({
    'ConvertedComp': 'median',
    'YearsCode': 'mean'
})
This groups the data by education level and then calculates the median salary and mean years of coding experience for each of those groups.
4. Custom Aggregations with .apply()
The built-in functions cover many cases, but sometimes you need to perform a more complex, custom calculation on your groups. Given your background in computer science, you'll appreciate that you can pass your own functions—often as lambda functions—to summarize groups. The .apply() method is perfect for this.
While .agg() is optimized for applying one or more specific aggregation functions that return a single value per group, .apply() is more flexible. It takes a function that is applied to each entire group DataFrame, and it can return a scalar, a Series, or even a DataFrame.
Let's watch a practical example where a custom lambda function is needed. The goal is to count how many people in each country know Python. A simple .count() won't work because the LanguageWorkedWith column contains strings like "HTML/CSS;JavaScript;Python". We need to check if the substring 'Python' is present for each person and then sum up the results for each country.
Python Pandas Tutorial (Part 8): Grouping and Aggregating - Analyzing and Exploring Your Data
This final segment from Corey Schafer's video is a fantastic, in-depth example of a realistic analysis task. It ties together grouping, string manipulation, and a custom lambda function with .apply().
Watch from 27:23 to 35:20. This is a longer segment, but it's worth it. First, he shows why a simple approach fails. Then, he builds the solution step-by-step: using .apply() with a lambda function, and finally combining multiple Series to calculate the percentage of Python users in each country. Focus on understanding the logic inside the lambda function: lambda x: x.str.contains('Python').sum().
This example is a perfect demonstration of the power and flexibility of groupby. The logic x.str.contains('Python').sum() works because:
.apply()passes each group (a slice of the DataFrame) asxto thelambdafunction.x.str.contains('Python')is applied to theLanguageWorkedWithcolumn of that group, returning a Series ofTrue/Falsevalues..sum()on a boolean Series treatsTrueas1andFalseas0, effectively counting the number of developers who know Python in that group.
Conclusion
Today you've mastered one of the most essential data manipulation skills in Pandas. You are now equipped to slice your data into meaningful groups and extract valuable insights by calculating summary statistics.
Key Takeaways:
- Split-Apply-Combine: This is the core mental model for all
groupbyoperations. .groupby(): Creates aDataFrameGroupByobject, which splits your data based on a key.- Simple Aggregations: You can chain methods like
.mean(),.median(),.sum(), and.count()to agroupbyobject to perform the "apply-combine" steps. .agg(): The most efficient way to apply multiple aggregations at once, especially when using a dictionary to apply different functions to different columns..apply(): Provides maximum flexibility for custom aggregations by allowing you to apply any function (includinglambdafunctions) to your groups.
Preview of the Next Lesson:
In this lesson, we focused on analyzing and summarizing data within a single DataFrame. However, real-world data is often spread across multiple files or tables. Our next lesson, "Merge, join, and concatenate multiple DataFrames", will teach you how to combine data from different sources into a single, unified DataFrame, setting the stage for even richer analysis.