Hello! Welcome to your next lesson in our module on Probability and Statistics Essentials.
In our last session, we explored probability distributions and saw how the famous Normal Distribution, or "bell curve," is completely defined by just two parameters: its center point (the mean, ) and its width (the standard deviation, ). This naturally leads to the question: if we have a set of data, how do we find these values?
Today, we'll answer that. This lesson is all about descriptive statistics, the fundamental techniques used to quantitatively summarize and describe the main features of a dataset. We will focus on the three most important metrics: mean, variance, and standard deviation. Mastering these is the first and most critical step in any data analysis or machine learning project.
1. Measures of Central Tendency: Finding the "Center"
When you get a new dataset, one of the first questions you'll ask is, "What does a typical value look like?" Measures of central tendency answer this question.
There are three common measures:
- Mean: The arithmetic average of all the data points.
- Median: The middle value when the data is sorted.
- Mode: The most frequently occurring value in the dataset.
The mean is the most common measure of center, but as you'll see, the median is more "robust" to extreme values or outliers. Since you have a strong background in programming, let's jump right into a practical explanation that uses the Pandas library you'll be working with extensively.
Python for Data Analysis: Descriptive Statistics
This video from the DataDaft channel provides an excellent introduction to measures of central tendency. It not only defines mean, median, and mode but also visually demonstrates how skewed data and outliers affect the mean differently than the median. This distinction is very important in practice.
Watch the first 5 minutes (from 00:00 to 05:11). Pay close attention to the Python examples using a Pandas DataFrame and the visual explanation of how the mean is 'pulled' by skewed data.
As the video explained, while the mean gives you the average, the median can often give you a better sense of the "typical" value in datasets with skewed distributions or extreme outliers (like house prices or salaries).
2. Measures of Spread: Variance and Standard Deviation
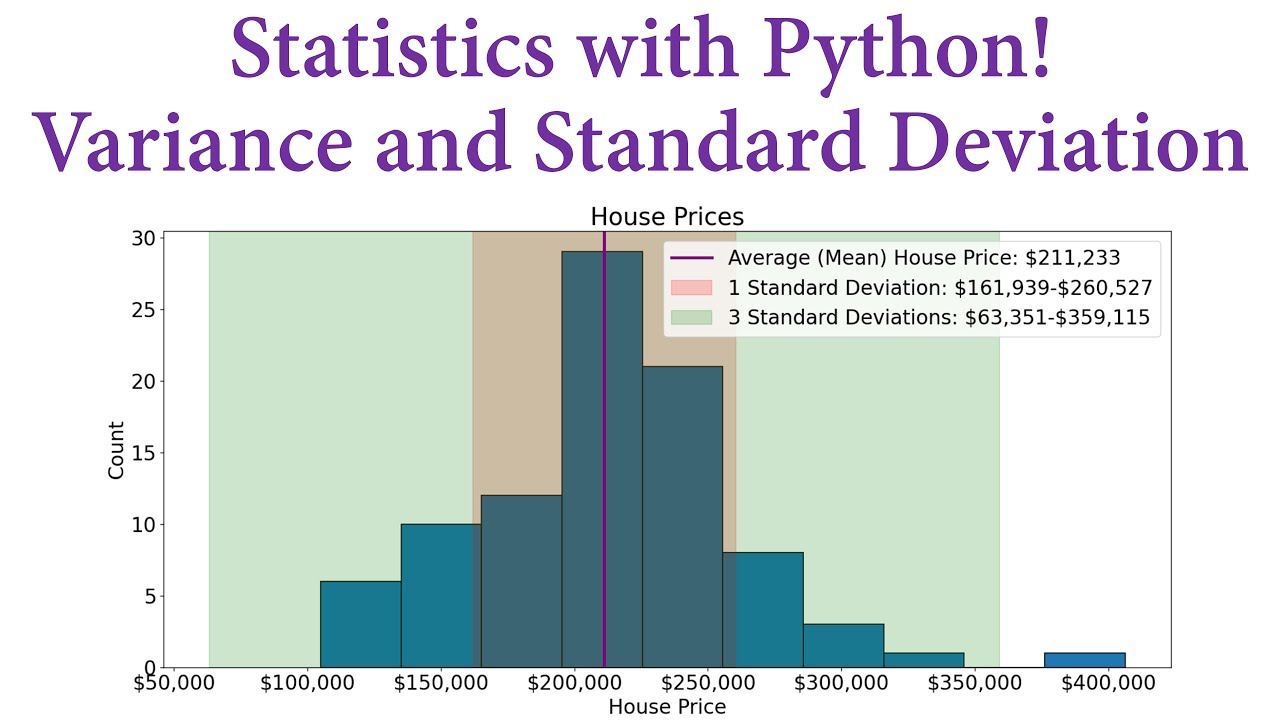
Knowing the center of the data is only half the story. We also need to know how spread out, or dispersed, the data is. Are all the data points clustered tightly around the mean, or are they scattered far and wide?
The Core Idea: Deviation from the Mean
To measure spread, we can calculate how far each data point is from the mean (). This is the deviation: .
If we just averaged these deviations, the positive and negative values would cancel each other out, summing to zero. To solve this, we square each deviation, making them all positive: .
- Variance ( or ): This is the average of the squared deviations. A larger variance means the data is more spread out.
- Standard Deviation ( or ): This is simply the square root of the variance. The key advantage is that it returns the measure of spread to the original units of the data, making it much more interpretable. For example, if you're measuring heights in centimeters, the standard deviation will also be in centimeters.
A Crucial Distinction: Population vs. Sample
This is one of the most important concepts in statistics.
- A population is the entire group you are interested in (e.g., all houses in a city).
- A sample is a smaller, manageable subset of that population (e.g., 1000 houses you collected data on).
In machine learning, we almost always work with samples. Our goal is to use the sample to estimate the characteristics of the entire population. This leads to a subtle but critical change in the formula for variance.
The following video provides an exceptionally clear explanation of this concept.
Calculating the Mean, Variance and Standard Deviation, Clearly Explained!!!
To properly calculate variance and standard deviation, we must know whether we are working with a population or a sample. This StatQuest video makes the distinction incredibly clear and explains the 'n-1' correction, a fundamental concept in statistics.
Please watch from 03:56 to 10:30. The first part (up to 07:12) covers the formula for the population variance and standard deviation, where you divide by the total number of data points, n. The second, more critical part (from 07:12 onwards) explains why, when using a sample to estimate the population variance, we must divide by n-1 to get a more accurate (unbiased) estimate.
To summarize the key takeaway from Josh Starmer's video:
- When you have data for the entire population, you calculate variance by dividing the sum of squared differences by .
- When you are using a sample to estimate the population's variance, you divide by . This is known as Bessel's correction.
Since we're almost always working with samples in data science, the version is the one you will use most of the time.
3. Computing Descriptive Statistics in Python
Now, let's bring this theory into code. Your tools of choice, NumPy and Pandas, have this distinction built right in. The key is a parameter called ddof, which stands for "Delta Degrees of Freedom." It's the value you subtract from n in the denominator.
ddof=0means the denominator is . Use this for population statistics.ddof=1means the denominator is . Use this for sample statistics.
The following guide shows you the exact syntax.
Descriptive statistics: Python guide (NumPy/Pandas)
This guide provides clear, practical code examples for calculating variance and standard deviation using both NumPy and Pandas. It's a great reference for translating the formulas we just discussed into Python.
Read the sections titled 'Variance' and 'Standard deviation'. Focus on the NumPy and Pandas code blocks. Pay special attention to the use of the ddof parameter in the .var() and .std() functions. This is how you implement the population vs. sample logic.
Here's a quick summary of the implementation. A crucial point to remember is that Pandas calculates sample statistics by default (ddof=1), which is usually what you want. NumPy defaults to population statistics (ddof=0).
import numpy as np
import pandas as pd

# Let's say this is a SAMPLE of data
data = [155, 160, 162, 175, 180]

# --- Using NumPy ---
# You must specify ddof=1 for sample statistics
sample_std_np = np.std(data, ddof=1)
# The default is ddof=0 for population statistics
pop_std_np = np.std(data) # or np.std(data, ddof=0)

print(f"NumPy Sample Std Dev (n-1): {sample_std_np:.2f}")
print(f"NumPy Population Std Dev (n): {pop_std_np:.2f}")
print("-" * 20)

# --- Using Pandas ---
s = pd.Series(data)
# Pandas defaults to ddof=1 for sample statistics
sample_std_pd = s.std()
# To get population std dev, you must specify ddof=0
pop_std_pd = s.std(ddof=0)

print(f"Pandas Sample Std Dev (n-1): {sample_std_pd:.2f}")
print(f"Pandas Population Std Dev (n): {pop_std_pd:.2f}")
Practical Shortcut: .describe()
Calculating these one by one is good for learning, but for quick analysis, Pandas provides a wonderfully convenient method: .describe(). It computes all the key descriptive statistics for a Series or DataFrame in one go.
s = pd.Series(data)
print("\nPandas .describe() output:")
print(s.describe())
Notice the output includes the count, mean, std (standard deviation), min, max, and percentiles (like the median, which is the 50% mark).
Test your understanding!
You are given a NumPy array containing the test scores of 200 students from a university with thousands of students. You want to estimate the standard deviation of test scores for the entire university.
Which of the following commands is the correct one to use, and why?
np.std(scores, ddof=0)np.std(scores, ddof=1)
Show answer
The correct command is 2. np.std(scores, ddof=1).
Reasoning: The 200 student scores represent a sample of the entire student population. To get an unbiased estimate of the population's standard deviation from this sample, you must use Bessel's correction, which means dividing by . In NumPy, this is achieved by setting ddof=1.
Conclusion
You've just learned how to compute the most fundamental descriptive statistics, which form the bedrock of exploratory data analysis. These simple numbers can tell you a powerful story about your data's central tendency and spread.
Key Takeaways:
- Mean, Median, and Mode describe the center of your data. The mean is the average, while the median is more robust to outliers.
- Variance and Standard Deviation describe the spread or dispersion of your data around the mean. Standard deviation is often preferred because it's in the same units as the original data.
- The distinction between Population and Sample statistics is crucial. When estimating population metrics from a sample, you must use the denominator (Bessel's correction).
- In Python, you control this using the
ddofparameter. Pandas defaults toddof=1(sample), while NumPy defaults toddof=0(population). - The
.describe()method in Pandas is your go-to for a quick statistical summary.
Preview of the Next Lesson:
We've introduced the important idea of populations and samples. In the next lesson, we will formalize this distinction. We'll explore what makes a good sample, the concept of sampling distributions, and why this is all so foundational for making inferences in machine learning.