Hello! Welcome to the next lesson in your journey through Probability and Statistics.
In our last session, we dove into descriptive statistics and discovered a subtle but critical detail: the formula for variance changes depending on whether you have data for the entire population or just a sample. You learned that when using a sample to estimate the population's characteristics, we divide by instead of .
Today, we will formalize and expand on this crucial distinction. The learning outcome for this lesson is to distinguish between population and sample statistics. We will clearly define what a population and a sample are, and then do the same for their corresponding numerical summaries: parameters and statistics. This concept is the absolute foundation of inferential statistics and, by extension, most of machine learning. We almost always build models on a sample of data, but our true goal is for the model to perform well on the entire population of unseen data.
Let's begin by solidifying our understanding of what a population and a sample are.
1. Population vs. Sample: The Whole and The Part
In statistics, these terms have very precise meanings:
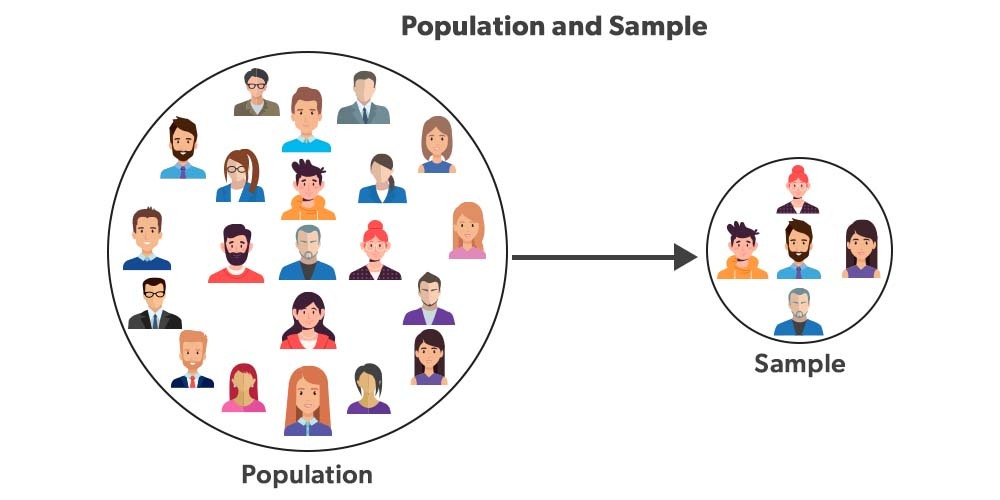
- A Population is the entire group of individuals, items, or events that we are interested in studying. It's the "whole."
- A Sample is a subset of the population, selected for analysis. It's a "part" of the whole.
Why Do We Use Samples?
You might wonder, "Why not just study the entire population?" In most real-world scenarios, especially in machine learning, studying the entire population is impractical or impossible due to several reasons:
- Cost: Collecting data from everyone or everything is prohibitively expensive.
- Time: It would take too long. Imagine trying to survey every voter before an election.
- Accessibility: The entire population may not be accessible. For example, the population of "all emails" includes future emails that haven't been written yet.
- Destructive Testing: Sometimes, the act of collecting data destroys the item. A factory can't test the lifespan of every light bulb it produces.
The following video provides some excellent real-world examples to clarify these ideas.
Tutorial 5: Population vs Sample in Statistics| Data Science| Machine Learning
This video from Neuraldata clearly defines population and sample and discusses the practical reasons for sampling. The exit poll example is a classic and intuitive illustration.
Watch the segment from 00:47 to 03:42. Focus on the definitions and the explanation of why sampling is a necessary and cost-effective process.
As you can see, the central challenge of data science is to use a manageable sample to learn something meaningful about the vast, often unknowable, population.
2. Parameter vs. Statistic: Describing the Data
Now that we have distinguished between the whole group (population) and the smaller part (sample), let's look at the numbers we use to describe them.
- A Parameter is a numerical value that describes a characteristic of a Population.
- A Statistic is a numerical value that describes a characteristic of a Sample.
A simple mnemonic to remember this is:
- Parameter -> Population
- Statistic -> Sample
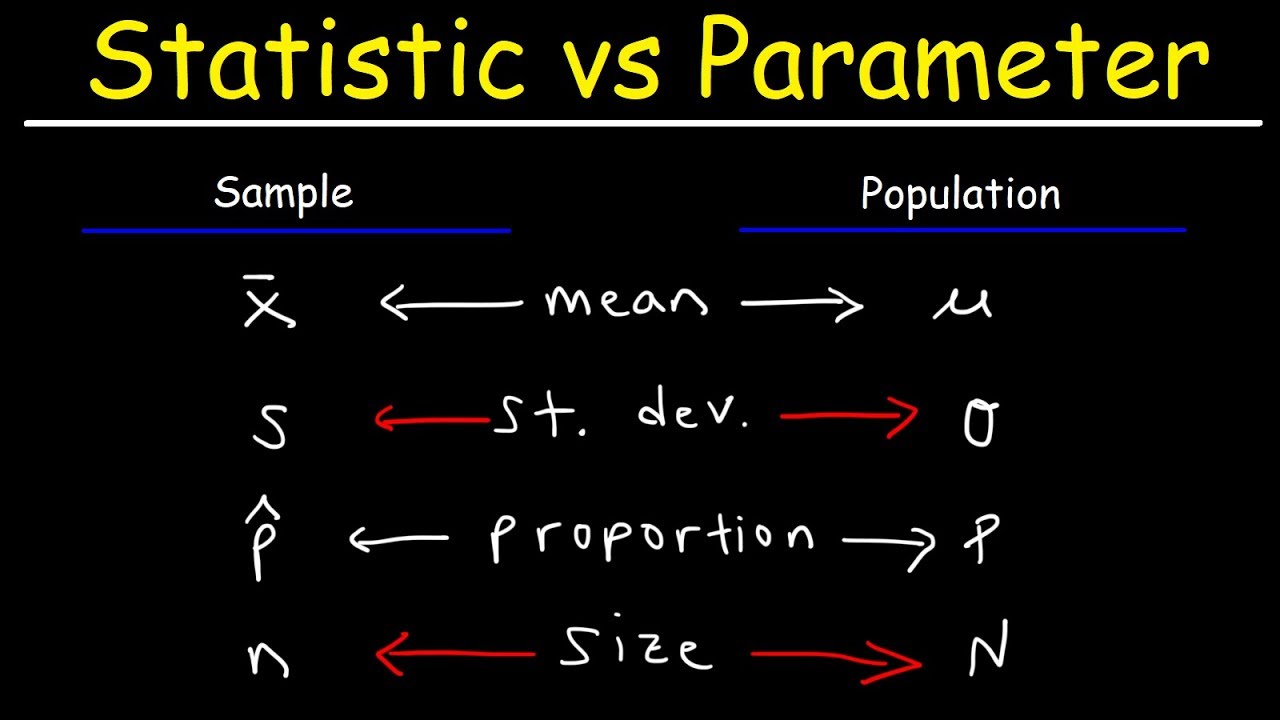
This brings us back to what we learned in the last lesson. The population mean () and population standard deviation () are parameters. The sample mean () and sample standard deviation () are statistics.
The video below does an excellent job of defining these terms and, importantly, introducing the standard notation used for each.
Statistic vs Parameter & Population vs Sample
This video from The Organic Chemistry Tutor is a concise and direct explanation of the difference between a statistic and a parameter. It also introduces the specific mathematical symbols used for each, which is essential vocabulary for statistics.
Watch the first 4 minutes of the video (00:00 to 04:06). Pay close attention to the list of symbols for sample statistics versus population parameters.
Here is a summary of the symbols discussed in the video, which you will see constantly in machine learning literature.
To solidify your understanding, consider these examples:
- Scenario 1: A study reports the average GPA of all 30,000 students at a university is 3.1.
- This is a parameter (), because it describes the entire population of students at that university.
- Scenario 2: A news poll surveys 1,000 voters and finds that 55% plan to vote for a certain candidate.
- This is a statistic (), because it describes a sample of voters, not all of them. The goal is to use this statistic to estimate the true population parameter (), which is the proportion of all voters who support the candidate.
Test your understanding!
For each statement, determine if the number described is a parameter or a statistic.
- A car manufacturer inspects 200 cars from a production line of 10,000 and finds that 3% have a defect.
- The median household income for all households in the city of San Francisco is calculated from census data.
- A researcher takes a sample of 50 trouts from a lake, measures their length, and calculates the average length to be 14.5 inches.
Show answer
- Statistic. The 3% defect rate is calculated from a sample of 200 cars, not the entire population of 10,000 cars.
- Parameter. The value is calculated using data from all households (the entire population) in the city.
- Statistic. The average length of 14.5 inches is calculated from a sample of 50 trouts, not all the trouts in the lake.
3. The Goal: Using Statistics to Estimate Parameters
So, why is this distinction so important? Because the ultimate goal of most data analysis and machine learning is inference.
Inferential Statistics is the process of using data from a sample to make inferences or draw conclusions about the population from which the sample was drawn.
We calculate a statistic from our sample because we hope it's a good estimate of the corresponding parameter in the population, which we can't measure directly. For example, we use the sample mean () to estimate the population mean ().
The following article explains this relationship clearly.
Parameter vs Statistic: Examples & Differences
This article, "Parameter vs Statistic: Examples & Differences" by Statistics By Jim, provides a great summary and highlights the core purpose of this topic. We'll focus on why researchers are ultimately interested in parameters, even though they can only calculate statistics.
Read the section titled "Researchers and Parameters vs Statistics." This short section perfectly encapsulates the 'why' behind everything we've discussed today.
For this process of inference to be reliable, the sample must be representative of the population. If we want to know the average height of all adults in a country, we can't just sample professional basketball players. Statisticians have developed various sampling methods to help ensure samples are as representative as possible, such as simple random sampling, where every member of the population has an equal chance of being selected.
Conclusion
Today, you've mastered a fundamental concept in statistics that underpins the entire field of machine learning. Understanding the relationship between a sample and a population is the first step toward building models that generalize to new, unseen data.
Key Takeaways:
- A Population is the complete set of interest, while a Sample is a manageable subset of that population.
- We use samples because studying entire populations is often impractical or impossible.
- A Parameter is a numerical summary of a population (e.g., population mean ).
- A Statistic is a numerical summary of a sample (e.g., sample mean ).
- The primary goal of inferential statistics is to use sample statistics to estimate population parameters.
- This distinction is reflected in the mathematical notation used (e.g., for population standard deviation, for sample standard deviation).
Preview of the Next Lesson:
We've established that we use a statistic (like the sample mean) to estimate a parameter (the population mean). But how much confidence can we have in that estimate? If our sample mean is 45, can we confidently say the population mean is also 45? Or could it be 42, or 50? This leads us into the world of hypothesis testing. In our next lesson, "Perform a t-test and interpret the p-value," we will learn our first formal method for testing a hypothesis about a population parameter using data from a sample.