Hello! Welcome to the third lesson in our module on Probability and Statistics Essentials.
In our last session, we delved into conditional probability and the powerful Bayes' Theorem. We saw how to update our beliefs about an event in light of new evidence. That was all about calculating the probability of single, discrete outcomes, like "does this patient have the disease?" or "was this item made by machine C?".
Today, we will broaden our perspective. Instead of focusing on a single outcome, we'll learn how to describe the probabilities of all possible outcomes of a random process. We do this using probability distributions. Our goal is to describe three of the most common and fundamental distributions you'll encounter in data science and machine learning: the Uniform, Binomial, and Normal distributions. Understanding these is like learning the basic vocabulary for describing and modeling data.
1. What is a Probability Distribution?
A probability distribution is a function that provides the probabilities of occurrence of different possible outcomes in an experiment. Think of it as a complete map of a random phenomenon.
We can broadly classify distributions into two types:
- Discrete Distributions: The variable can only take on a countable number of distinct values. For example, the outcome of a dice roll (1, 2, 3, 4, 5, 6) or the number of heads in 10 coin flips.
- Continuous Distributions: The variable can take any value within a given range. For example, the height of a person or the temperature of a room.
Let's explore our first distribution, which is the simplest of them all.
2. The Uniform Distribution: All Outcomes are Equal
The uniform distribution is characterized by one simple rule: every possible outcome has an equal probability of occurring.
A classic example of a discrete uniform distribution is rolling a fair six-sided die. The probability of rolling a 1, 2, 3, 4, 5, or 6 is exactly the same: .
However, in machine learning, we often deal with continuous uniform distributions. Imagine you have a program that generates a random number between 10 and 30. If any number in that range is equally likely to be chosen, this follows a continuous uniform distribution.
Let's watch a quick conceptual overview.
The 6 MUST-KNOW Statistical Distributions MADE EASY [4/13]
This short clip from a video by Andrew Jones provides a very clear and concise explanation of the uniform distribution using the dice roll example.
Watch from 06:04 to 06:38 to get a quick visual and conceptual handle on the uniform distribution.
Visualizing the Uniform Distribution
For a continuous uniform distribution defined on an interval from to , its graph is a simple rectangle.
- The base of the rectangle is the interval .
- The height is constant across this interval and is . This ensures that the total area under the curve is , a fundamental rule for all probability distributions.
Python Implementation
Now, let's see how to work with this in Python. We can use the scipy.stats library, a powerful tool for statistical functions, to generate data from a uniform distribution and visualize it.
The following resource provides a tutorial on this. We'll focus on the Uniform Distribution section.
Probability Distributions in Python Tutorial
This DataCamp tutorial, 'Probability Distributions in Python', demonstrates how to create and plot a uniform distribution. It's a great first look at how statistical concepts are translated into code.
Read the section 'Uniform Distribution Function' and the following 'Uniform Distribution in Python'. Pay attention to the uniform.rvs() function and its arguments (loc, scale, size). Note how Seaborn's distplot is used for visualization.
Let's break down the key piece of code from that tutorial:
from scipy.stats import uniform
import seaborn as sns

# Generate 10,000 random variates from a uniform distribution
# starting at 'loc' = 10, with a 'width' (scale) of 20.
# So, numbers will be between 10 and 10+20=30.
data_uniform = uniform.rvs(size=10000, loc=10, scale=20)

# Plot the distribution
ax = sns.distplot(data_uniform, bins=100)
ax.set(xlabel='Uniform Distribution', ylabel='Frequency')
Running this code produces a histogram that is roughly flat, resembling the rectangle we discussed.
3. The Binomial Distribution: A Story of Success and Failure
Next up is the binomial distribution. This is a discrete distribution that models the number of "successes" in a fixed number of independent trials, where each trial has only two possible outcomes (e.g., success/failure, heads/tails, win/lose).
Think about these scenarios:
- The number of heads you get after flipping a coin 10 times.
- The number of defective items in a batch of 50.
- The number of patients who recover after 20 receive a new drug.
These can all be modeled by a binomial distribution. The key conditions are:
- A fixed number of trials ().
- Each trial is independent.
- Each trial has only two outcomes.
- The probability of success () is constant for each trial.
Let's watch a video that explains this using the coin flip experiment.
The 6 MUST-KNOW Statistical Distributions MADE EASY [4/13]
This video segment by Andrew Jones gives an excellent intuitive explanation of the binomial distribution by building it up from a simple coin flip experiment.
Watch from 03:07 to 05:03. Notice how the distribution shows which outcomes (e.g., 5 heads out of 10 flips) are most likely.
Python Implementation
The binomial distribution is defined by its parameters (number of trials) and (probability of success). In Python, we can again use scipy.stats to explore it.
Probability Distributions in Python Tutorial
Let's return to the DataCamp tutorial to see how the binomial distribution is implemented in Python.
Read the sections 'Binomial Distribution Function' and 'Binomial Distribution in Python'. Focus on the binom.rvs() function and its parameters n and p. Notice how the shape of the plotted histogram changes based on the value of p.
Here is the essential code:
from scipy.stats import binom

# Generate data from a binomial distribution
# n=10 trials, p=0.8 probability of success, repeated 10,000 times
data_binom = binom.rvs(n=10, p=0.8, size=10000)

# Plot the distribution
ax = sns.distplot(data_binom, kde=False) # kde=False is good for discrete dists
ax.set(xlabel='Binomial Distribution', ylabel='Frequency')
If you were to run this code with p=0.5, the distribution would be symmetric around 5. Since p=0.8, the distribution is skewed to the left, with the peak around 8, which makes intuitive sense: if success is likely, we expect more successes.
4. The Normal Distribution: The Bell Curve
The normal distribution, also known as the Gaussian distribution or "bell curve," is arguably the most important probability distribution in statistics. It's a continuous distribution that arises everywhere in nature and data science. Heights, weights, measurement errors, and test scores often follow a normal distribution.
Its key characteristics are:
- It's symmetric around its mean.
- The mean, median, and mode are all equal.
- Its shape is determined by two parameters: the mean (), which sets the center of the distribution, and the standard deviation (), which determines its spread or width.
To build a solid intuition for this, the StatQuest video is one of the best resources available.
The Normal Distribution, Clearly Explained!!!
Josh Starmer from StatQuest provides a fantastic, clear explanation of the normal distribution, focusing on how the mean and standard deviation define its shape.
Watch from 00:30 to 04:24. Pay close attention to the comparison between baby and adult height distributions. This perfectly illustrates how a smaller standard deviation leads to a taller, narrower curve, and a larger standard deviation results in a shorter, wider curve.
The 68-95-99.7 Rule
A very useful property of the normal distribution is the empirical rule, or the "68-95-99.7 rule". This rule states:
- Approximately 68% of the data falls within 1 standard deviation of the mean ().
- Approximately 95% of the data falls within 2 standard deviations of the mean ().
- Approximately 99.7% of the data falls within 3 standard deviations of the mean ().
This rule is a great mental shortcut for quickly understanding the spread of normally distributed data.
Python Implementation
Finally, let's see how to generate and plot a normal distribution in Python.
Probability Distributions in Python Tutorial
We'll use our DataCamp tutorial one last time to see the Python code for the normal distribution.
Read the sections 'Normal Distribution Function' and 'Normal Distribution in Python'. Note the use of norm.rvs() and its loc (mean) and scale (standard deviation) parameters.
The core Python code is very similar to what we've seen before:
from scipy.stats import norm

# Generate data from a normal distribution with mean=0 and stddev=1
data_normal = norm.rvs(size=10000, loc=0, scale=1)

# Plot the distribution
ax = sns.distplot(data_normal, bins=100)
ax.set(xlabel='Normal Distribution', ylabel='Frequency')
This generates the classic bell shape. By changing loc and scale, you can shift and stretch this curve just as described in the StatQuest video.
Visual Summary
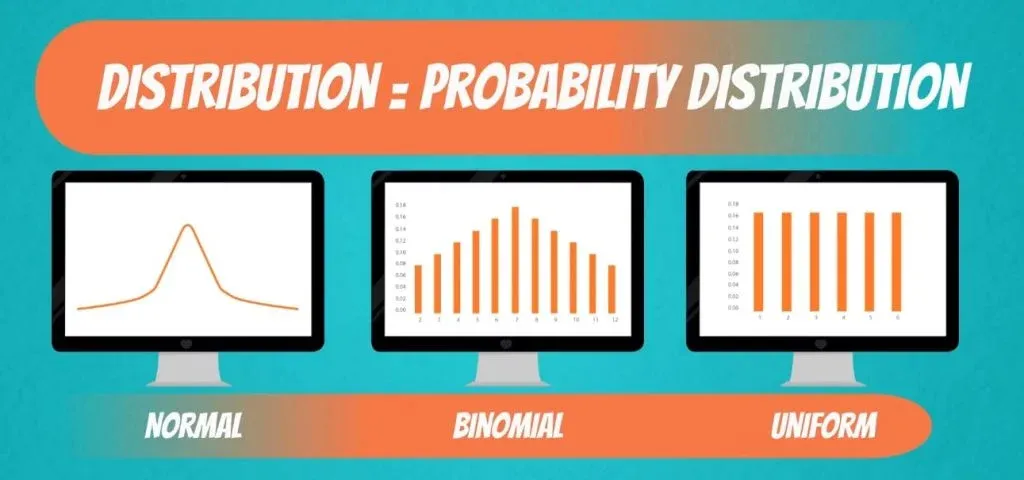
Here is a great image that shows the shapes of the three distributions we've discussed side-by-side. It's a useful visual reminder of their distinct characteristics.
Test your understanding!
For each of the following scenarios, which of the three distributions (Uniform, Binomial, or Normal) would be the most appropriate model?
- A call center wants to model the number of successful sales made in 100 calls, where the probability of a sale on any given call is 15%.
- The heights of adult males in a large country.
- A random number generator that produces values between 0.0 and 1.0, where any value in the range is equally likely.
Show answer
- Binomial Distribution: This is a classic case. We have a fixed number of trials (), each with two outcomes (sale or no sale), and a constant probability of success ().
- Normal Distribution: Human physical characteristics like height are very frequently modeled by a normal distribution. Most people are near the average height, with fewer people being extremely tall or short.
- Uniform Distribution: The key phrase is "equally likely." Since any value in the range [0.0, 1.0] has the same chance of being selected, this is a continuous uniform distribution.
Conclusion
In this lesson, we've moved from single probabilities to understanding the entire landscape of outcomes through probability distributions. These are essential tools for a data scientist.
Key Takeaways:
- Probability distributions describe the likelihood of all possible outcomes of a random variable.
- The Uniform Distribution models situations where all outcomes in a range are equally likely. It looks like a rectangle.
- The Binomial Distribution models the number of successes in a fixed number of discrete, independent trials. It's represented by bars.
- The Normal Distribution (or "bell curve") is a continuous distribution defined by its mean and standard deviation. It's symmetric and ubiquitous in real-world data.
- Libraries like
scipy.statsandseabornmake it straightforward to work with and visualize these distributions in Python.
Preview of the Next Lesson:
We saw today that the normal distribution is defined by its mean and standard deviation. But how do we get those values from a set of data? In the next lesson, we will focus on descriptive statistics. You'll learn how to compute fundamental metrics like mean, variance, and standard deviation from a dataset, which are the first steps in summarizing and understanding any data you encounter.