Hello! Welcome back to our module on Probability and Statistics Essentials.
In our last lesson, we took our first steps into the world of probability. We learned how to define sample spaces, count outcomes, and apply the basic rules of probability, like the addition rule for P(A or B). We saw that many probability problems can be solved by carefully counting possibilities.
Today, we're going to explore one of the most powerful and fundamental concepts in all of probability: conditional probability. This will lead us directly to Bayes' Theorem, a rule that is not just a mathematical curiosity but a cornerstone of machine learning, scientific reasoning, and data analysis. Our goal for this lesson is to learn how to apply Bayes' theorem to compute conditional probabilities, which essentially means learning how to update our beliefs in the light of new evidence.
1. From Probability to Conditional Probability
In the previous lesson, we asked questions like, "What is the probability of rolling a 7 with two dice?" Now, we'll ask a slightly different kind of question: "What is the probability that you rolled a 7, given that you know at least one of the dice is a 5?"
This "given that" part is the key. It means we have new information that changes the set of possible outcomes. The original sample space has been reduced. This new probability is called a conditional probability, denoted as , which reads "the probability of A given B".
The formal definition of conditional probability is:
Where is the probability that both A and B happen. In essence, we're restricting our universe to the outcomes where B is true, and then looking at the proportion of those outcomes where A is also true.
Let's watch a short video that derives this formula and then shows how it gives rise to Bayes' Theorem.
Bayes' Theorem of Probability With Tree Diagrams & Venn Diagrams
This video from The Organic Chemistry Tutor provides a clear algebraic derivation of Bayes' Theorem, starting from the basic definition of conditional probability.
Watch the first 2 minutes and 28 seconds of the video. The goal is to see how the formula for Bayes' Theorem is just a simple rearrangement of the conditional probability formulas we already know.
As you just saw, by writing out the definitions for and and noting that is the same as , we can easily arrive at:
This is Bayes' Theorem. It looks simple, but its implications are profound. It gives us a way to "flip" a conditional probability—if we know , we can find .
2. The Intuition: Updating Beliefs with Evidence
Before we dive into calculations, let's build a strong intuition for what Bayes' Theorem really does. It's a formal recipe for updating our beliefs. We start with an initial belief (a "prior") and, when we see new evidence, we update our belief to a new one (a "posterior").
There's no better way to understand this than with a classic thought experiment. The following video from 3Blue1Brown is one of the best explanations available.
Bayes theorem, the geometry of changing beliefs
This video masterfully builds the intuition behind Bayes' theorem using the story of 'Steve the librarian/farmer'. It demonstrates the core idea of updating prior beliefs without even mentioning the formula at first.
Watch from 01:04 to 08:37. The first part (until 04:46) presents the thought experiment. Pay close attention to how the narrator combines the base rate (the ratio of farmers to librarians) with the evidence (Steve's personality description). The second part generalizes this reasoning into the formal Bayes' Theorem, connecting the intuitive steps to the mathematical formula.
The core takeaway is that our final belief shouldn't be based on the evidence alone. It should be a blend of our prior belief and the new evidence. The "Steve" example showed that even if the evidence strongly suggests "librarian," the low prior probability of being a librarian means the final answer might still be "farmer."
3. The Language of Bayes' Theorem
To apply the theorem effectively, we need to know the standard names for its components. This will help you map real-world problems onto the formula.
Let's use a medical diagnosis example to make this concrete: "What is the probability a patient has cancer given a positive test result?"
-
Posterior:
This is what we want to calculate: the probability of having cancer after seeing the positive test result. It's our updated belief. -
Prior:
This is our belief before seeing the evidence. It's the base rate or prevalence of cancer in the general population. -
Likelihood:
This is the probability of seeing our evidence (a positive test) if our hypothesis is true (the patient has cancer). This is often related to the test's "sensitivity." -
Evidence:
This is the total probability of observing the evidence, regardless of whether the person has cancer or not. This is often the trickiest part to calculate.
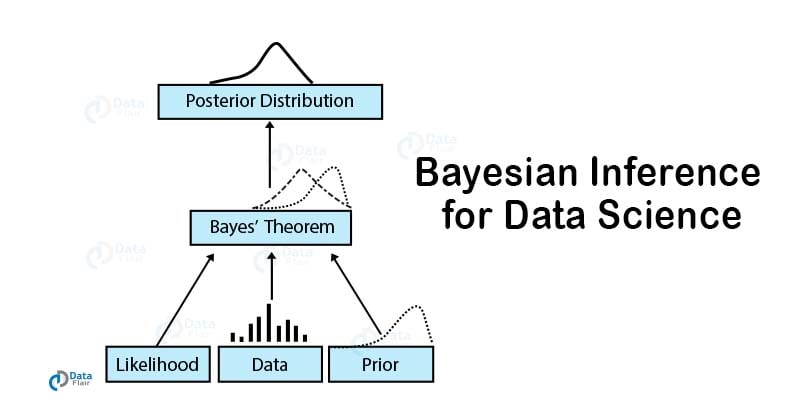
The following article provides a great summary of these terms and then dives into the classic medical diagnosis problem.
A Gentle Introduction to Bayes Theorem for Machine ...
This article, 'A Gentle Introduction to Bayes Theorem for Machine Learning', clearly defines the terms in the theorem and walks through a practical example.
Read the section titled 'Naming the Terms in the Theorem'. It provides a clear mapping of the formula's parts to their conceptual names (Posterior, Prior, etc.).
4. A Worked Example: The Deceptive Disease Test
Now let's put everything together with a full-fledged example. This problem is famous because the result is often surprisingly counter-intuitive and highlights a common statistical mistake known as the base rate fallacy.
Problem:
A disease has a prevalence of 1% in the population (our prior). A test for this disease has 95% accuracy:
- It correctly identifies 95% of sick people (true positive rate, our likelihood).
- It correctly identifies 95% of healthy people (true negative rate).
If a randomly selected person gets a positive test result, what is the probability they actually have the disease (the posterior)?
Most people's intuition says the probability should be around 95%. Let's see what Bayes' Theorem says.
To solve this, we first need to calculate the denominator, . A positive result can happen in two ways:
- A person has the disease AND tests positive (a true positive).
- A person does NOT have the disease AND tests positive (a false positive).
We use the law of total probability to add these two mutually exclusive scenarios. A tree diagram is an excellent tool for visualizing this calculation.
Let's watch a video that solves a nearly identical problem using this method.
Bayes' Theorem of Probability With Tree Diagrams & Venn Diagrams
This video walks through a cancer screening problem, which is a classic application of Bayes' Theorem. Pay close attention to how a tree diagram is used to calculate the total probability of a positive test.
Watch from 08:32 to 15:40. Follow the construction of the tree diagram to see how all the probabilities are laid out, which makes calculating the final answer straightforward.
Now, let's see this same logic laid out in text and code. The article you looked at earlier provides a manual calculation and a Python function for a similar problem. Seeing the problem worked out in a different way will help solidify your understanding.
A Gentle Introduction to Bayes Theorem for Machine ...
This article provides a detailed manual calculation and a Python implementation of the medical test problem.
Read the sections 'Manual Calculation' and 'Python Code Calculation'. Compare the steps in the manual calculation with the tree diagram from the video. Then, examine the Python function, which is a great example of how you would implement this in practice.
As you can see, the actual probability is much lower than 95%! This is because the base rate of the disease is so low that the number of false positives from the large healthy population outweighs the true positives from the small sick population. This is a critical lesson in data interpretation.
Test your understanding!
A factory has three machines (A, B, C) producing items.
- Machine A produces 20% of the output. 5% of its items are defective.
- Machine B produces 30% of the output. 3% of its items are defective.
- Machine C produces 50% of the output. 1% of its items are defective.
You pick a random item from the factory's output and find that it is defective. What is the probability that it was produced by Machine C?
Hint: You are asked to find .
Show answer
Let's break it down using Bayes' Theorem:
-
Identify the knowns:
- Prior : The probability an item is from machine C is 50% or 0.5.
- Likelihood : The probability an item is defective given it's from C is 1% or 0.01.
-
Calculate the Evidence :
This is the total probability of getting a defective item, from any machine. We sum the probabilities of the three ways this can happen:So, .
-
Apply Bayes' Theorem:
So, there is only a 20.8% chance that the defective item came from Machine C, even though Machine C produces half of the total output! This is because its defect rate is so low.
Conclusion
Today we've tackled one of the most important theorems in probability. You've seen how a simple rule for "flipping" conditional probabilities allows us to formalize the process of learning from data.
Key Takeaways:
- Conditional probability, , is the probability of event A happening given that event B has already occurred.
- Bayes' Theorem, , allows us to calculate a conditional probability when its "reverse" is known.
- The theorem is best understood as a way to update beliefs: we move from a prior belief to a posterior belief after observing evidence.
- Calculating the total probability of the evidence, , often requires breaking it down into all possible scenarios (e.g., using a tree diagram).
- Always be mindful of the base rate; ignoring it is a common and serious error in reasoning.
Preview of the Next Lesson:
So far, we've dealt with discrete events like coin flips and disease tests. But what about continuous measurements like height, temperature, or the price of a stock? In the next lesson, we will explore common probability distributions (like the Normal, Binomial, and Uniform distributions), which are the mathematical tools we use to model and understand both discrete and continuous random variables.