Hello! Welcome to your next lesson on classification algorithms.
In our last session, we dove deep into decision trees. You learned that they are intuitive and interpretable, but have a significant weakness: they are prone to overfitting and can be unstable, meaning small changes in the data can lead to a very different tree.
Today, we'll tackle that weakness head-on by exploring Random Forests. This powerful algorithm leverages the "wisdom of the crowd" by combining many decision trees into a single, more robust model. As the name suggests, if one tree is good, a whole forest should be better!
Our learning goal for this lesson is to build and evaluate a Random Forest classifier. By the end, you'll understand:
- The core principles of Random Forests: bagging and feature randomness.
- How to implement and train a Random Forest using
scikit-learn. - The key hyperparameters that define a Random Forest.
- How to evaluate its performance, including unique methods like the Out-of-Bag score.
Let's start with a high-level look at the process.
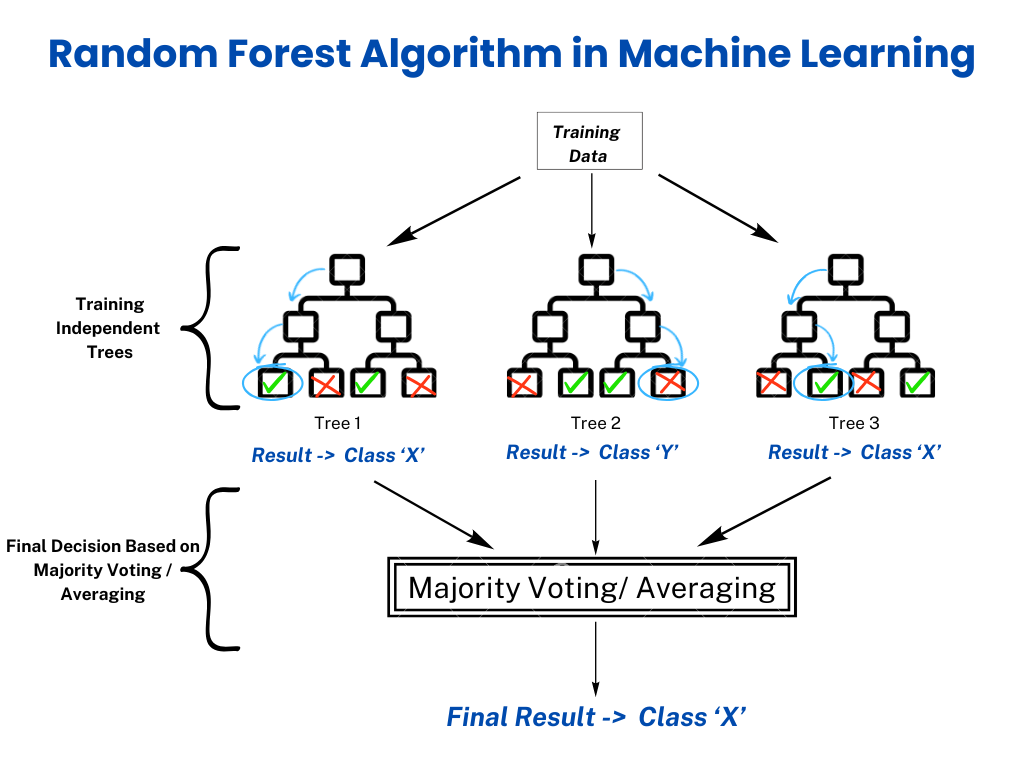
From a Single Tree to a Forest
The main problem with a single decision tree is its high variance. It can learn the training data, including its noise, too well. A Random Forest is an ensemble method designed to reduce this variance by averaging out the errors of many individual trees.
How does it ensure that the trees are different from each other? It introduces randomness in two key ways.
From Decision Trees to Random Forests
To understand how Random Forests improve upon single decision trees, read this section from 'A Practical Guide to Random Forests in Machine Learning' on DigitalOcean. It explains the concepts of bagging and feature randomness.
Read the subsections 'The Idea of Using Multiple Trees', 'Randomness Adds Strength', 'The Role of Bagging (Bootstrap Aggregating)', and 'Feature Bagging – The Random Forest Twist'. This will clarify the two core ideas that give the algorithm its power.
Let's watch a video that visualizes these two concepts: Bootstrapping and Random Feature Selection.
StatQuest: Random Forests Part 1 - Building, Using and Evaluating
The 'StatQuest: Random Forests' video by Josh Starmer provides an excellent, step-by-step visual explanation of how a Random Forest is built.
Watch the following two segments: Creating a Bootstrap Dataset (01:21 - 02:24): This shows how a new dataset is created from the original by sampling with replacement. This is the "Bootstrap" part of "Bootstrap Aggregating" (Bagging). Building a Tree with Random Features (02:24 - 04:34): This illustrates the second source of randomness. At each split in a tree, only a random subset of features is considered.
To summarize, a Random Forest builds multiple decision trees, where each tree is trained on:
- A bootstrap sample of the data (randomly selected rows, with replacement).
- With splits chosen from a random subset of features at each node.
Once the forest is trained, how does it make a prediction? For classification, it's simple democracy.
StatQuest: Random Forests Part 1 - Building, Using and Evaluating
Let's continue with the StatQuest video to see how the trained forest makes a prediction.
Watch from 04:34 to 05:53. This segment demonstrates how a new data point is run through every tree, and the final classification is determined by a majority vote.
The combination of these techniques makes Random Forests one of the most reliable and widely used machine learning algorithms. Here is a helpful table comparing it to the single Decision Tree you learned about last time.
Difference between Decision Trees and Random Forests
This table from the DigitalOcean guide provides a concise summary of the key differences between Decision Trees and Random Forests.
Review the table to solidify your understanding of the trade-offs. Pay special attention to the rows on 'Overfitting Tendency', 'Accuracy', and 'Interpretability'.
Building a Random Forest with scikit-learn
Now for the practical part. Since a Random Forest is an ensemble of decision trees, you'll find its implementation in scikit-learn's ensemble module. The workflow is identical to what you've seen before.
The following video demonstrates the entire process, from loading data to training the model and checking its performance.
Machine Learning Tutorial Python - 11 Random Forest
This video from the 'codebasics' channel provides a clear, hands-on demonstration of implementing a Random Forest classifier in Python.
Watch from 02:32 to 08:37. This covers loading the dataset, splitting it, and then importing, training (.fit()), and scoring (.score()) the RandomForestClassifier.
Here's the essential code structure for building and training your model:
from sklearn.datasets import make_classification
from sklearn.model_selection import train_test_split
from sklearn.ensemble import RandomForestClassifier
from sklearn.metrics import accuracy_score

# 1. Generate some data
X, y = make_classification(n_samples=1000, n_features=20, n_informative=15, n_redundant=5, random_state=42)

# 2. Split data
X_train, X_test, y_train, y_test = train_test_split(X, y, test_size=0.3, random_state=42)

# 3. Create and train the Random Forest model
# The model is in the 'ensemble' module
# We start with 100 trees (n_estimators=100)
rf_clf = RandomForestClassifier(n_estimators=100, random_state=42, n_jobs=-1)
rf_clf.fit(X_train, y_train)

# 4. Make predictions and evaluate
y_pred = rf_clf.predict(X_test)
accuracy = accuracy_score(y_test, y_pred)
print(f"Accuracy: {accuracy:.4f}")
Notice the n_jobs=-1 parameter. This is a practical tip: it tells scikit-learn to use all available CPU cores to build the trees in parallel, which can significantly speed up training.
Key Hyperparameters
While a Random Forest has many hyperparameters, two are most fundamental to its structure. The others, like max_depth and min_samples_leaf, are the same as those for individual decision trees and control the complexity of each tree in the forest.
Random Forest Hyperparameters in Scikit-learn
For a detailed list and explanation of the most important hyperparameters, refer to this section in the DigitalOcean guide.
Read through the explanations for n_estimators, max_features, and oob_score. You can skim the others, as they are similar to what you learned for Decision Trees.
-
n_estimators: The number of trees in the forest.- This is the most important hyperparameter.
- Generally, more trees increase the model's performance and stability, but the benefit diminishes after a certain point.
- More trees also mean longer training and prediction times. The default in
scikit-learnis 100, which is often a reasonable starting point.
-
max_features: The size of the random subset of features to consider at each split.- Lowering this value reduces the correlation between trees, which can help combat overfitting.
- The default is
'sqrt'(the square root of the total number of features), which is a common and effective choice.
Test your understanding!
You have trained a Random Forest model that you suspect is still overfitting slightly. Which of the following two actions would be most likely to reduce this overfitting?
- Increase
n_estimatorsfrom 100 to 500. - Decrease
max_depthfor the trees in the forest. - Increase
max_featuresfrom'sqrt'to all features. - Decrease
n_estimatorsfrom 100 to 10.
Show answer
The correct answer is 2. Decrease max_depth. By limiting the depth of each individual tree, you make each base learner simpler and less prone to overfitting the training data, which in turn helps the overall forest generalize better.
Let's analyze the other options:
-
- Increasing
n_estimatorsusually helps reduce variance and makes the model more stable. It's unlikely to increase overfitting and might help reduce it, but decreasingmax_depthis a more direct way to control complexity.
- Increasing
-
- Increasing
max_featureswould make the trees more similar to each other (less random), which could actually increase the risk of overfitting.
- Increasing
-
- Decreasing
n_estimatorssignificantly reduces the model's ability to average out errors and would likely lead to a less stable and potentially less accurate model.
- Decreasing
Evaluating Random Forest Performance
You can evaluate a Random Forest using the same metrics as any other classifier, like accuracy and the confusion matrix. But it also comes with some unique, built-in evaluation tricks.
Out-of-Bag (OOB) Score
Remember that each tree is trained on a bootstrap sample, which means it doesn't see all the training data. On average, about one-third of the training samples are left out for each tree. These are the Out-of-Bag (OOB) samples.
We can use these OOB samples as a built-in validation set to evaluate the model's performance without needing a separate train-test split. This is particularly useful when you have a small dataset.
StatQuest: Random Forests Part 1 - Building, Using and Evaluating
Let's return to the StatQuest video for a final time to understand the concept of Out-of-Bag error, which is the basis for the OOB score.
Watch from 05:53 to 08:29. This segment clearly explains how the samples left out of the bootstrap process can be used to test the trees that weren't trained on them.
To use this in scikit-learn, you simply set oob_score=True when creating your classifier. After training, you can access the score via the .oob_score_ attribute.
# Create a model with OOB scoring enabled
rf_clf_oob = RandomForestClassifier(n_estimators=100, oob_score=True, random_state=42, n_jobs=-1)

# Fit the model (only on training data)
rf_clf_oob.fit(X_train, y_train)

# Access the OOB score
print(f"OOB Score: {rf_clf_oob.oob_score_:.4f}")
# This score is calculated using data not seen by each tree during training.
Feature Importance
Because a Random Forest uses many trees, it can provide a more robust and reliable estimate of feature importance than a single decision tree. It calculates importance by averaging the impurity decrease contributed by each feature across all trees in the forest. This is a great way to understand what features are driving your model's predictions.
More Random Forest Evaluation Metrics
This section of the DataCamp article 'Random Forest Classification in Python' shows how to generate evaluation metrics and, most importantly, visualize the feature importances.
Focus on the code snippet at the end of the section that creates a bar plot of feature importances. This is a very common and useful visualization.
Here is how you can access and plot them:
import pandas as pd
import matplotlib.pyplot as plt

# Assuming rf_clf is your trained model and X_train has feature names
importances = rf_clf.feature_importances_
feature_names = [f"feature_{i}" for i in range(X.shape[1])] # Example feature names

forest_importances = pd.Series(importances, index=feature_names)

fig, ax = plt.subplots()
forest_importances.sort_values(ascending=False).head(10).plot.bar(ax=ax)
ax.set_title("Top 10 Feature importances using MDI")
ax.set_ylabel("Mean decrease in impurity")
fig.tight_layout()
plt.show()
Conclusion
Congratulations! You've mastered another state-of-the-art classification algorithm. Random Forests are a go-to model for many data scientists because they are powerful, relatively easy to use, and less prone to overfitting than single decision trees.
Key Takeaways:
- Random Forests are an ensemble of decision trees that improve accuracy and reduce variance.
- They introduce randomness through bagging (bootstrap sampling of data) and random feature subspaces.
- Predictions are made by majority vote (for classification).
- The most important hyperparameter is
n_estimators(the number of trees). - They offer powerful built-in evaluation methods like the Out-of-Bag (OOB) score and robust feature importance measures.
Preview of the Next Lesson:
Random Forest is one type of ensemble method, where models are built independently and in parallel. But what if we built them sequentially, where each new model tries to fix the mistakes of the previous one? This is the idea behind another powerful family of algorithms called boosting. In our next lesson, we will explore Gradient Boosting, a technique that often pushes the boundaries of predictive accuracy even further.