Hello! Welcome to your next lesson on the fundamentals of machine learning.
In our last session, we mastered cross-validation, a robust technique for how to evaluate a model by getting a stable performance estimate. We saw that cross_val_score returns an array of scores, but we used metrics like R-squared ('r2') without a deep dive.
Today, we'll answer the question of what to measure. The choice of metric is not arbitrary; it's a critical decision that depends entirely on the type of problem you're solving and what you define as a "good" prediction.
Lesson Introduction
This lesson covers the most common evaluation metrics used in machine learning. By the end, you will be able to describe and choose appropriate metrics for both regression and classification tasks. Specifically, you will learn:
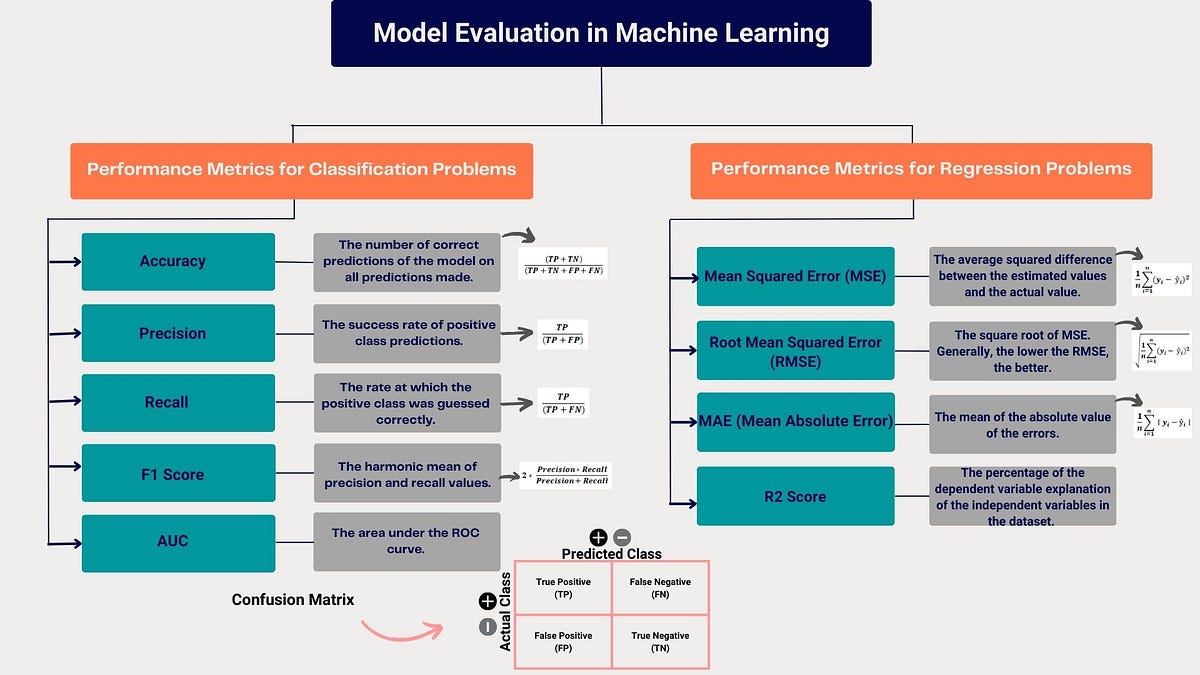
- Regression Metrics: How to measure error for models that predict continuous values (e.g., a price). We'll cover Mean Absolute Error (MAE), Mean Squared Error (MSE), Root Mean Squared Error (RMSE), and the R-squared (R²) score.
- Classification Metrics: How to evaluate models that predict discrete categories (e.g., 'spam' or 'not spam'). We'll explore Accuracy, Precision, Recall, and the F1-Score, all derived from the fundamental Confusion Matrix.
This handy flowchart provides a great overview of the metrics we'll be exploring today.
1. Regression Metrics: Measuring the Error
For regression tasks, where the model's output is a continuous number (like predicting a house price or temperature), evaluation is about measuring the difference, or error, between the predicted values and the actual values.
Let's start with a video that builds the intuition for these error metrics from the ground up.
Error / Loss Functions for Regression: Mean Squared Error (MSE), Mean Absolute Error (MAE), RMSE
This video from Greg Hogg provides a clear, visual explanation of how regression errors are calculated. It will help you understand the practical meaning of each metric.
Watch the following segments to grasp the core ideas: What is Error? (00:08 - 01:42): Understand error as the vertical distance between the predicted line and the actual data points. Mean Absolute Error (MAE) (03:38 - 05:08): See how MAE gives an average error in the original units of your target. Mean Squared Error (MSE) (05:08 - 07:12): Learn why squaring the error heavily penalizes larger mistakes. Root Mean Squared Error (RMSE) (07:12 - 08:21): Understand how RMSE brings the metric back to the original units, making it more interpretable than MSE.
As the video explains, MAE, MSE, and RMSE all provide a measure of the average error magnitude. A lower value is always better, with a perfect model scoring 0.
Now, let's solidify these concepts and introduce a different, but equally important, regression metric: R-squared (R²).
Performance Metrics in Machine Learning [Complete Guide]
This guide from Neptune.ai provides concise definitions, formulas, and key insights for each regression metric. Pay special attention to the section on R-squared, which measures performance from a different perspective.
Read the section titled 'Regression metrics'. Focus on the 'key points' for MSE, MAE, and RMSE to reinforce what you saw in the video. Then, read the section on 'R² Coefficient of determination' carefully to understand what it represents.
Summarizing Regression Metrics
Unlike the error-based metrics, R-squared doesn't tell you the magnitude of the error. Instead, it tells you the proportion of the variance in the target variable that is predictable from the features.
- An R² of 0.75 means your model explains 75% of the variability in the data.
- An R² of 0 means your model is no better than just predicting the mean of the target variable.
- An R² can even be negative if your model is worse than predicting the mean.
Here’s a summary table to help you keep these metrics straight:
| Metric | Formula | Key Characteristic | Units |
|---|---|---|---|
| MAE | $\frac{1}{n}\sum_{i=1}^{n} | y_i - \hat{y}_i | $ |
| MSE | Penalizes large errors heavily; differentiable. | Target units squared | |
| RMSE | Interpretable version of MSE; penalizes large errors. | Same as target | |
| R² | Measures proportion of variance explained. | Unitless (0 to 1) |
Test your understanding!
Imagine you are building a model to predict house prices. A few of your predictions are off by a very large amount (e.g., predicting $200,000 for a $1,000,000 house). Which metric, MAE or MSE, would be more sensitive to these huge errors and why?
Show answer
MSE (Mean Squared Error) would be much more sensitive. Because it squares the difference (y - ŷ), a large error of $800,000 becomes a massive squared error of 640,000,000,000. This single point would heavily inflate the overall MSE. MAE, on the other hand, would just add the absolute error of $800,000, which is large but doesn't have the same explosive effect. Therefore, if large errors are particularly undesirable in your application, optimizing for a lower MSE is a common strategy.
2. Classification Metrics: More Than Just Accuracy
For classification tasks, where the model predicts a category (e.g., dog or cat, spam or not spam), we can't just measure a distance. Instead, we count how many predictions were correct and incorrect.
The most intuitive metric is accuracy: the percentage of correct predictions. However, accuracy can be dangerously misleading, especially with imbalanced datasets. For example, if a disease affects 1% of the population, a model that always predicts "no disease" will be 99% accurate, but it's completely useless!
To get a more complete picture, we start with the Confusion Matrix.
The Confusion Matrix
The confusion matrix is a table that breaks down the performance of a classification model. For a binary (two-class) problem, it looks like this:
| Predicted: Positive | Predicted: Negative | |
|---|---|---|
| Actual: Positive | True Positive (TP) | False Negative (FN) |
| Actual: Negative | False Positive (FP) | True Negative (TN) |
- True Positive (TP): The model correctly predicted the positive class. (e.g., correctly identified a spam email as spam).
- True Negative (TN): The model correctly predicted the negative class. (e.g., correctly identified a normal email as not spam).
- False Positive (FP): The model incorrectly predicted the positive class. (e.g., a normal email was flagged as spam). This is also known as a Type I Error.
- False Negative (FN): The model incorrectly predicted the negative class. (e.g., a spam email was missed and went to the inbox). This is also known as a Type II Error.
Almost all other classification metrics are calculated from these four numbers. This next video does an excellent job of building up from these basic counts to the more advanced metrics.
Precision, Recall, F1 score, True Positive|Deep Learning Tutorial 19 (Tensorflow2.0, Keras & Python)
The 'codebasics' channel provides a fantastic, step-by-step walkthrough of classification metrics using a simple 'dog vs. not a dog' example.
This video builds the concepts piece by piece. Please watch the following segments: TP, FP, TN, FN Explained (00:47 - 03:37): See how every prediction is categorized into one of these four groups. Accuracy (03:37 - 04:06): The simplest metric, calculated from the four values above. Precision (04:06 - 04:55): Learn its formula and interpretation: Of all the positive predictions, how many were actually correct? Recall (04:55 - 06:01): Learn its formula and interpretation: Of all the actual positives, how many did we find? F1-Score (07:22 - 07:56): Understand it as a single metric that balances Precision and Recall. Implementation (07:56 - 10:59): See how to get a confusion matrix and a full classification_report in Python with scikit-learn.
Precision vs. Recall: A Critical Trade-off
As the video highlighted, precision and recall measure different aspects of a model's performance, and there's often a trade-off between them.
- High Precision: The model is very trustworthy when it predicts the positive class. It makes few false positive errors.
- High Recall: The model is very good at finding all the positive cases. It makes few false negative errors.
Let's explore this trade-off further.
Performance Metrics in Machine Learning [Complete Guide]
Let's return to the Neptune.ai guide to review the classification metrics and better understand the trade-off between precision and recall.
In the 'Classification metrics' section, quickly review the definitions for 'Accuracy', 'Confusion Matrix', 'Precision', and 'Recall'. Then, read the section on the 'Precision-Recall tradeoff' to understand why improving one often comes at the cost of the other.
The F1-Score is the harmonic mean of precision and recall. It provides a single number that balances both metrics, which is useful when you need to compare two models and don't have a strong preference for either precision or recall.
Test your understanding!
Consider a model for detecting fraudulent credit card transactions. The "positive" class is 'fraud'. Which is more important to optimize for: precision or recall? Why? What is the real-world consequence of a False Positive versus a False Negative in this case?
Show answer
In this scenario, optimizing for Recall is almost always more important.
- A False Negative (FN) means a fraudulent transaction was missed. The real-world consequence is financial loss for the customer or the bank. This is a very bad outcome.
- A False Positive (FP) means a legitimate transaction was flagged as fraud. The consequence is an inconvenience for the customer (their card is declined, they might get a text message to verify). This is annoying, but far less damaging than letting fraud occur.
Therefore, you want to build a model that is excellent at finding all the fraudulent transactions (high recall), even if it means you occasionally flag a few legitimate ones by mistake (lower precision).
Conclusion
You now have a solid understanding of the essential metrics for evaluating machine learning models. Choosing the right metric is as important as choosing the right algorithm, as it defines the "goal" you are optimizing for.
Key Takeaways:
- Regression Metrics measure prediction error for continuous values.
- MAE is the average absolute error, easy to interpret.
- MSE and RMSE heavily penalize large errors.
- R² measures the percentage of variance your model explains.
- Classification Metrics evaluate performance on categorical predictions.
- Accuracy is simple but can be misleading on imbalanced datasets.
- The Confusion Matrix (TP, TN, FP, FN) is the foundation for most other metrics.
- Precision answers: "Of the items we flagged as positive, how many were correct?" (Minimizes FPs).
- Recall answers: "Of all the actual positive items, how many did we find?" (Minimizes FNs).
- The F1-Score provides a single, balanced measure of precision and recall.
Preview of the Next Lesson:
We've learned how to measure performance. Now, how do we use these measurements to diagnose problems? In the next lesson, we will learn how to identify overfitting and underfitting. By comparing a model's performance metrics on the training set versus the validation set, we can determine if our model is failing to learn the patterns (underfitting) or learning the training data's noise too well (overfitting).