Hello! Welcome to the next lesson in your machine learning journey.
In our last session, we established the "gold standard" for model evaluation: splitting data into training, validation, and test sets. This ensures we can tune our model on the validation set without "peeking" at the final test set, giving us an honest measure of performance.
However, this method has a potential weakness. The performance score you get on your validation set can be highly dependent on the "luck of the draw"—which specific data points happened to end up in that set. If your validation set accidentally contains particularly easy or hard examples, your evaluation will be misleadingly optimistic or pessimistic.
This lesson introduces a more robust and reliable technique to solve this very problem.
Lesson Introduction
Today, we will dive into cross-validation, a powerful method for model evaluation that minimizes the impact of how the data is split. You will learn the logic behind the most common technique, k-fold cross-validation, and how to apply it and its variants in Python using scikit-learn. This will give you a much more confident and stable estimate of your model's true performance.
By the end of this lesson, you will be able to apply various cross-validation techniques to get a reliable measure of your model's effectiveness.
1. The Problem with a Single Split
As we discussed, a single validation set might not be representative of the overall data. So, how can we get a more reliable performance estimate? What if, instead of one split, we created several different splits and averaged the results? This is the core idea behind cross-validation.
Let's start with a video that beautifully illustrates this concept.
Machine Learning Fundamentals: Cross Validation
The 'StatQuest with Josh Starmer' channel is famous for making complex topics easy to understand. This video will show you why a single train/test split can be problematic and how cross-validation provides a more robust solution.
Watch the video from the beginning up to 04:45. Pay close attention to: Why using a single, fixed block of data for testing isn't ideal. How k-fold cross-validation systematically uses every block for testing exactly once.
The process described in the video is called k-fold cross-validation, where 'k' is the number of groups (or "folds") we split the data into.
Here is a visual summary of the process for k=5:
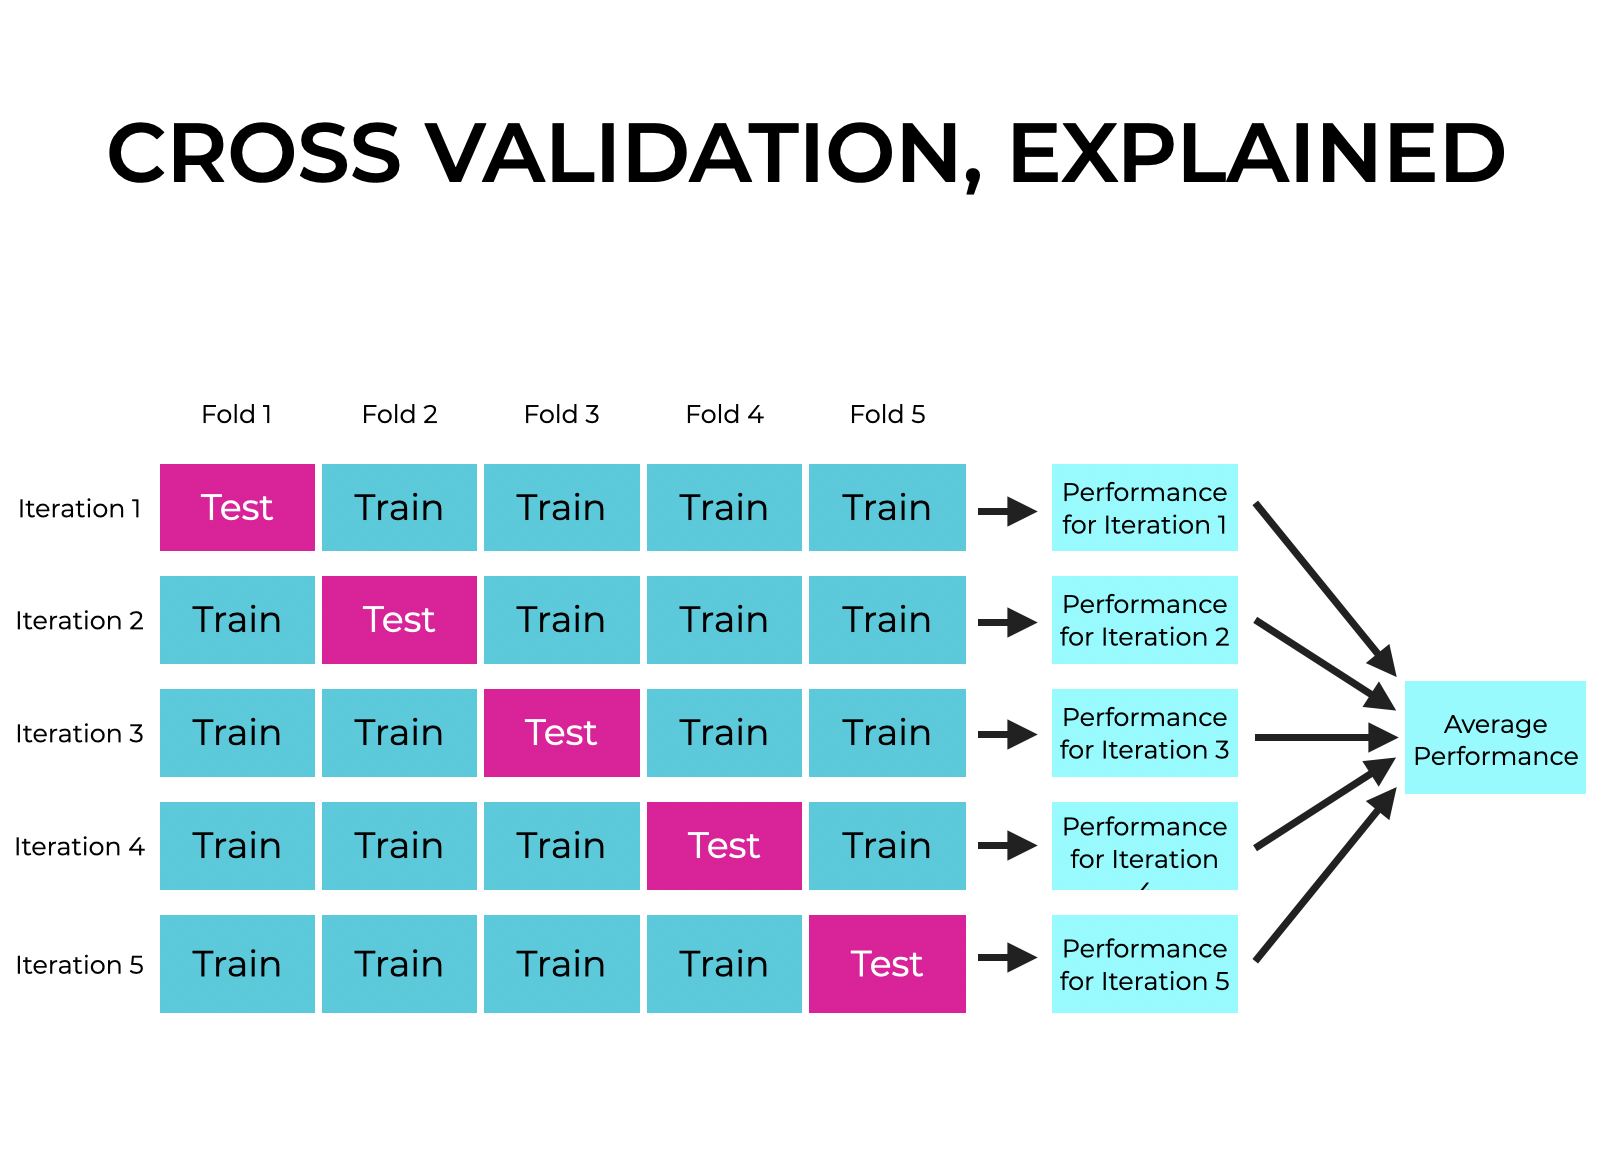
The key benefits of this approach are:
- More Reliable Performance Estimate: By averaging the performance across k different folds, our estimate is less sensitive to the randomness of a single split.
- More Efficient Data Usage: Every data point gets to be in a test set once and in a training set k-1 times. This is especially valuable when you have a limited amount of data.
2. Cross-Validation in the Full ML Workflow
This is a crucial point that can trip up beginners: cross-validation does not eliminate the need for a final test set.
Cross-validation is a technique for improving how you use your validation set. The entire k-fold process is performed on the data you would have otherwise set aside for training and validation. The test set remains locked away until the very end.
This diagram from the scikit-learn documentation shows the full picture perfectly:
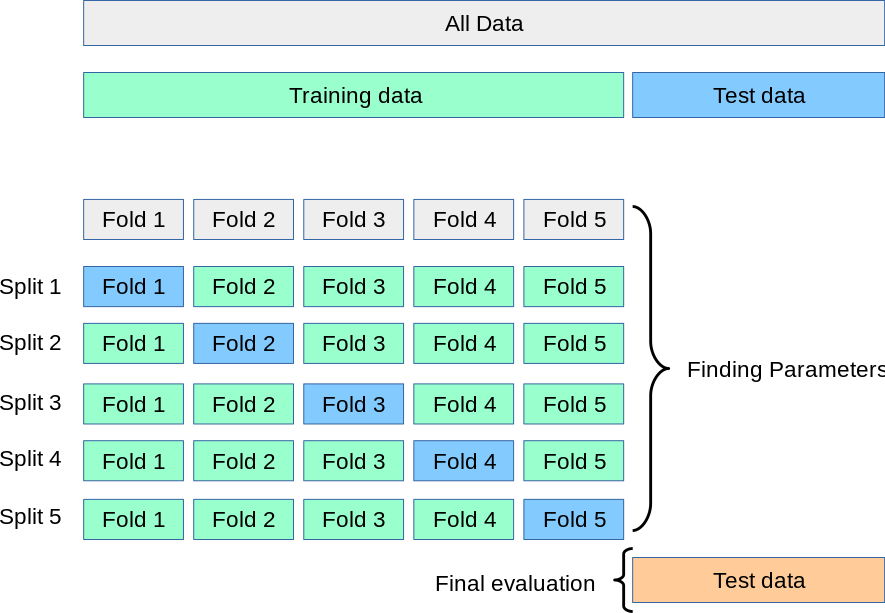
So, the workflow we learned in the last lesson is updated as follows:
- Split your entire dataset into a training set and a test set.
- Perform k-fold cross-validation on the training set to select your best model and tune its hyperparameters.
- Once you have your final model, evaluate it once on the test set to get your final performance metric.
3. Implementing Cross-Validation in Python
Now that you understand the "why," let's move to the "how." As you'd expect, scikit-learn provides excellent tools for this. We'll explore two ways: a slightly more manual approach to see the mechanics and a convenient one-liner function.
The following video provides a practical, code-along demonstration.
Machine Learning Tutorial Python 12 - K Fold Cross Validation
This video from the 'codebasics' channel is a great practical guide. It will walk you through implementing cross-validation from the ground up and then show you the easy shortcut.
Please watch the segment from 08:06 to 21:41. Focus on two key parts: The 'Manual' Way (08:06 - 19:19): See how the StratifiedKFold object is used in a for loop to generate training and testing indices for each fold. This reveals what's happening under the hood. The 'Easy' Way (19:19 - 21:41): Discover the cross_val_score function, which performs the entire k-fold process in a single line of code.
3.1. The cross_val_score Function
As you saw, while it's useful to understand the for loop mechanism, in practice you will almost always use the cross_val_score function. It's clean, simple, and less prone to error.
Here’s a clean example building on what you saw in the video, using the California Housing dataset for a regression task.
import numpy as np
from sklearn.datasets import fetch_california_housing
from sklearn.linear_model import LinearRegression
from sklearn.model_selection import cross_val_score, KFold

# 1. Load data
X, y = fetch_california_housing(return_X_y=True)

# 2. Define the model
model = LinearRegression()

# 3. Set up the K-Fold cross-validation strategy
# We'll use 5 folds, shuffle the data, and set a random_state for reproducibility
kf = KFold(n_splits=5, shuffle=True, random_state=42)

# 4. Perform cross-validation
# cv=kf tells the function to use our defined KFold strategy
# scoring='r2' specifies the metric we want to calculate
scores = cross_val_score(model, X, y, cv=kf, scoring='r2')

# 5. Print the results
print(f"Scores for each fold: {scores}")
print(f"Average R^2 score: {np.mean(scores):.4f}")
print(f"Standard deviation of scores: {np.std(scores):.4f}")

# Example Output:
# Scores for each fold: [0.57582089 0.61373562 0.60859341 0.62134543 0.58747448]
# Average R^2 score: 0.6014
# Standard deviation of scores: 0.0163
The output gives us not just a single performance score, but an array of scores—one for each fold. The average is our new, more robust estimate of the model's performance. The standard deviation tells us how consistent the model's performance was across the different folds. A low standard deviation is desirable, as it suggests the model is not overly sensitive to the specific training data it sees.
Test your understanding!
You run 10-fold cross-validation on two different models, A and B.
- Model A scores:
[0.91, 0.92, 0.90, 0.91, 0.93, 0.92, 0.90, 0.91, 0.92, 0.91] - Model B scores:
[0.98, 0.85, 0.99, 0.82, 0.97, 0.86, 0.99, 0.83, 0.98, 0.86]
Calculate the average score for both. Which model would you probably trust more, and why?
Show answer
- Model A Average:
np.mean(scores_A) ≈ 0.913 - Model B Average:
np.mean(scores_B) ≈ 0.913
Both models have the same average performance. However, Model A's scores are very consistent (low variance), ranging only from 0.90 to 0.93. Model B's scores are all over the place (high variance), from 0.82 to 0.99.
You would likely trust Model A more. Its performance is stable and predictable. Model B's high variance suggests it is very sensitive to the training data; its high scores might be due to "lucky" splits, and its low scores are a major concern.
4. Variations of Cross-Validation
Standard KFold is the default, but scikit-learn offers several other strategies tailored to specific situations.
Cross-validation: evaluating estimator performance
The scikit-learn documentation is the ultimate source of truth. This page provides a comprehensive overview of cross-validation and the various strategies available.
Read the sections titled 'Cross-validation iterators with stratification...', 'Cross-validation iterators for grouped data', 'Cross validation of time series data', and 'A note on shuffling'. You don't need to memorize every detail, but focus on understanding the purpose of these key variants: StratifiedKFold: Why is it essential for classification tasks, especially with imbalanced classes? GroupKFold: When would you use this? (Think about data where samples are not independent, like multiple measurements from the same patient). TimeSeriesSplit: Why is shuffling a bad idea for time-series data, and how does this splitter respect temporal order?
This article from DataCamp provides a fantastic summary table comparing the most common methods.
A Comprehensive Guide to K-Fold Cross Validation
This DataCamp tutorial provides another clear guide to K-Fold CV, and includes an excellent summary table that you can use as a quick reference.
Review the comparison table in the section 'Standard K-Fold vs. Other Cross-Validation Methods'. This is a great cheat sheet for remembering when to use each CV type.
The most important variant for you to know right now is Stratified K-Fold. Just as we used stratify=y in train_test_split for classification, StratifiedKFold ensures that each fold has the same percentage of samples for each class as the complete dataset. This is crucial for avoiding situations where a fold might, by chance, contain few or no samples of a minority class.
The good news is that when you use cross_val_score with an integer cv value (e.g., cv=5) on a classification model, scikit-learn is smart enough to use StratifiedKFold by default!
Conclusion
You've now added a critical tool to your machine learning toolkit. Cross-validation moves you beyond relying on a single data split and towards a much more rigorous and trustworthy method of evaluating your models.
Key Takeaways:
- A single validation set can give a misleading performance score due to the "luck of the draw" in the data split.
- K-Fold Cross-Validation solves this by splitting the data into 'k' folds, training on k-1 folds, and testing on the remaining fold, rotating until every fold has been a test set.
- The final performance is the average of the scores across all folds, providing a more stable and reliable estimate.
- The test set is still held out and is only used once for the final evaluation after model selection is complete.
- The
cross_val_scorefunction inscikit-learnis the easiest way to perform cross-validation. - Specialized strategies like Stratified K-Fold are essential for classification tasks to preserve class balance in each fold.
Preview of the Next Lesson:
So far, we've used metrics like R² and accuracy without much thought. But are they always the right choice? In the next lesson, we will explore the landscape of evaluation metrics. You'll learn which metrics to use for regression vs. classification, and how to choose the right one based on your specific problem (e.g., is it worse to have a false positive or a false negative?).