Recommended resources
The freely available resources this lesson will direct you to.
Hello! Welcome back to our study of economics.
In our previous lessons, we established that scarcity forces us to make choices (involving opportunity costs) and that rational decisions are made at the margin by comparing additional benefits and costs. Today, we'll introduce our first major economic model: the Production Possibilities Frontier (PPF).
This powerful graph provides a visual framework for the concepts of scarcity, opportunity cost, and trade-offs. By the end of this lesson, you will be able to interpret a PPF and use it to explain the crucial economic concept of efficiency. This model will become a cornerstone for understanding more complex topics, including the gains from trade, which we will tackle next.
1. Visualizing Scarcity and Choice
Imagine an economy that can produce only two types of goods, say, consumer goods (like smartphones) and capital goods (like the machines that make smartphones). This economy has a fixed amount of resources—labor, technology, factories, and raw materials. The PPF answers a simple question: Given these limited resources, what are all the possible combinations of smartphones and machines this economy can produce in a year?
The PPF graph shows the maximum possible production of one good for every possible level of production of the other.
To start, let's watch a video that introduces the PPF and shows how to construct it from a simple data table.
Production Possibilities Curve Review
This video from Jacob Clifford provides an excellent introduction to the Production Possibilities Curve (or Frontier). It clearly shows how to plot the graph from a set of possible production combinations.
Watch the first minute of the video (00:00 - 01:13). Notice how the table of possibilities translates directly into points on a graph, which are then connected to form the frontier.
As the video demonstrates, the resulting curve, or "frontier," represents a boundary. This boundary allows us to visualize several key economic ideas.
2. Interpreting the PPF: Efficiency and Attainability
A PPF diagram is divided into three distinct areas:
- On the frontier: Any point on the curve itself.
- Inside the frontier: Any point in the area between the curve and the axes.
- Outside the frontier: Any point beyond the curve.
Each of these areas has a specific economic meaning related to efficiency and what is possible.
Production Possibilities Curve Review
Let's continue with the same video to understand what these different points on the graph represent.
Watch from 01:13 to 02:24. Focus on the definitions of: Inefficient points (inside the curve) Efficient points (on the curve) Impossible/Unattainable points (outside the curve)
To summarize and reinforce this:

- Scarcity is represented by the frontier itself and the unattainable region beyond it. There's a limit to what we can produce.
- Trade-offs are shown by the need to move along the curve. To get more of one good, we must produce less of the other.
- Efficiency (specifically, productive efficiency) is represented by the points on the curve. At these points, the economy is getting the most out of its resources.
- Inefficiency is represented by any point inside the curve. This indicates that resources are being wasted (e.g., high unemployment or idle factories).
3. The Shape of the PPF and Opportunity Cost
Notice that the PPF is typically drawn as a curve that is "bowed out" from the origin. This shape is not arbitrary; it illustrates a fundamental economic principle: the Law of Increasing Opportunity Cost.
This law states that as you produce more and more of one good, the opportunity cost (the amount of the other good you must give up) will increase.
Why does this happen? Because resources are not equally suited for all types of production. When an economy starts to shift production from, say, cotton to wine, it first moves the resources best suited for making wine (e.g., workers with winemaking skills, land ideal for vineyards). The initial opportunity cost is low—we don't give up much cotton. However, to produce even more wine, we eventually have to move resources that were excellent for growing cotton but poor for making wine. At this stage, we give up a lot of cotton for only a small increase in wine production.
2.2 The Production Possibilities Frontier and Social Choices
The textbook 'Principles of Economics' provides a great explanation for why the PPF is curved using the example of healthcare and education. It walks through the logic step-by-step.
Please read the section titled 'The PPF and the Law of Increasing Opportunity Cost'. Focus on understanding how shifting resources that are not perfectly adaptable leads to the bowed-out shape.
Not all PPFs are bowed out. If the resources are perfectly adaptable between the two goods (e.g., producing red buses vs. blue buses), the opportunity cost is constant, and the PPF is a straight line.
Production Possibilities Curve Review
The following video segment does an excellent job of contrasting a straight-line PPF (constant opportunity cost) with a bowed-out PPF (increasing opportunity cost).
Watch from 03:23 to 04:54. Pay close attention to the examples used (corn vs. wheat and cactus vs. pineapples) to understand why the shape differs.
The slope of the PPF at any given point measures the opportunity cost of producing one more unit of the good on the horizontal axis. For a bowed-out curve, the slope gets steeper as we move to the right, indicating that the opportunity cost is increasing.
4. Productive vs. Allocative Efficiency
So far, we have used the term "efficiency" to mean that we are on the PPF rather than inside it. This is more precisely called productive efficiency.
- Productive Efficiency: It is impossible to produce more of one good without decreasing the quantity produced of another good. All points on the PPF are productively efficient.
However, there is another type of efficiency that is just as important: allocative efficiency.
- Allocative Efficiency: The particular mix of goods being produced—the specific point on the PPF—is the one that society most desires.
While there are many productively efficient points (all the points on the curve), there is only one point that is also allocatively efficient. The PPF itself does not tell us which point this is; it only lays out the possible options. Determining the allocatively efficient point requires us to know what consumers want and are willing to pay for.
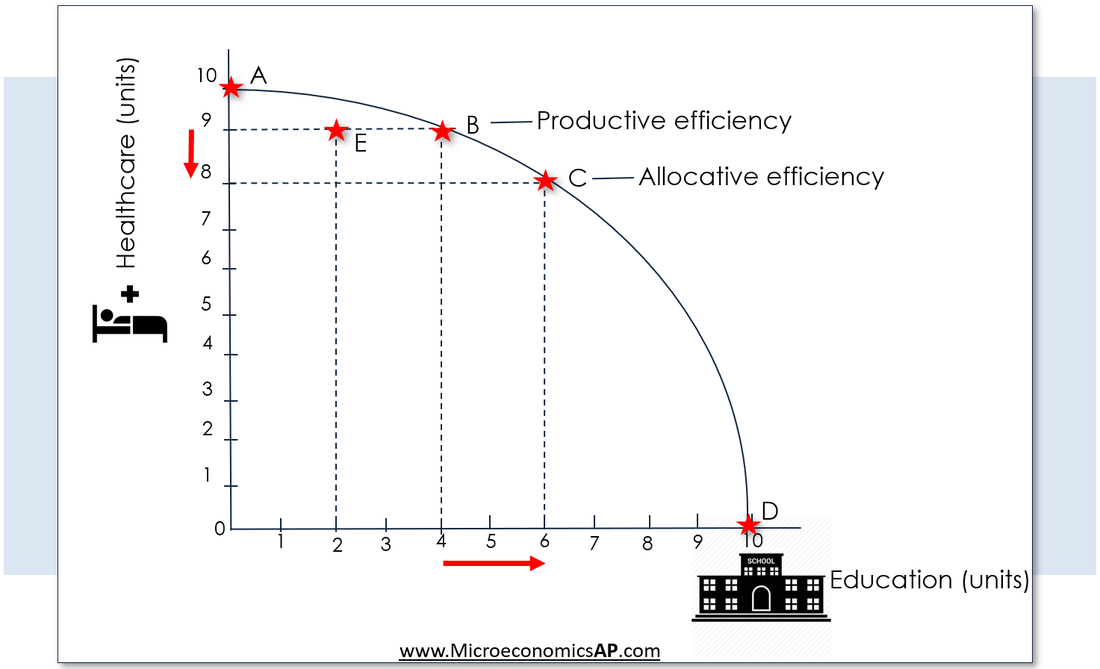
To explore this distinction further, let's watch one more video.
Y1 2) Production Possibility Curves - PPCs / PPFs
This video from EconplusDal provides a more formal discussion of the different types of efficiency in the context of the PPF.
Watch the segment from 05:54 to 09:24. Focus on the distinction he makes between: Productive efficiency (any point on the curve). Allocative efficiency (the one point on the curve that society wants most). Pareto efficiency (a related concept where no one can be made better off without making someone else worse off; all points on the PPF are Pareto efficient).
This distinction is crucial. An economy could be productively efficient, making the maximum possible amount of goods, but if it's producing goods nobody wants (e.g., millions of left shoes and no right shoes), it is not allocatively efficient.
Conclusion
In this lesson, we introduced the Production Possibilities Frontier, a fundamental tool for visualizing an economy's production choices under conditions of scarcity.
Here are the key takeaways:
- The PPF is a graphical model showing the maximum combinations of two goods that can be produced with available resources and technology.
- Points on the curve are productively efficient, points inside are inefficient, and points outside are unattainable.
- The bowed-out shape of the PPF illustrates the Law of Increasing Opportunity Cost, which arises because resources are not perfectly adaptable.
- Productive efficiency means getting the most output from available resources (being on the PPF). Allocative efficiency means producing the specific mix of goods that society desires most (being at the best point on the PPF).
The PPF clearly illustrates the limits an economy faces. But what if an economy could move beyond its frontier? In our next lesson, we will explore the principle of comparative advantage. You will see how specialization and trade can allow individuals and countries to consume a combination of goods that lies outside their own PPF, leading to mutual gains for everyone involved.