Recommended resources
The freely available resources this lesson will direct you to.
Hello again. Last lesson, you used weights to combine several vectors into one. This lesson asks where a useful kind of weight can come from. A model may produce a list of raw scores called logits; softmax converts that list into nonnegative numbers that sum to one. We’ll calculate the conversion by hand and see why the resulting numbers can serve as class probabilities—and, later in the course, as attention weights.
Allow about 35–40 minutes, including the video, reading, and worked calculations.
Why raw scores need converting
Imagine a classifier considering cat, dog, and horse. For one image, it outputs the logits
The cat score is highest, but is not a probability. Logits need not lie between zero and one, and they need not add up to one; other images might produce negative scores. Simply dividing each logit by their sum would not reliably fix this: a negative logit could become a negative “probability.”
Watch these portions of StatQuest’s Neural Networks Part 5: ArgMax and SoftMax. They establish the problem and show a calculation with three class scores. Skip the intervening discussion of derivatives; we will study those later.
Neural Networks Part 5: ArgMax and SoftMax
StatQuest with Josh Starmer shows why neural-network outputs cannot be read directly as probabilities, then computes softmax values for three classes.
Watch raw scores to see why logits need converting. Continue with the calculation, then three properties: the ranking stays the same, each result lies between zero and one, and the results sum to one. Finish with the formula. Notice that each class gets a different numerator but shares the same denominator.
Softmax: exponentiate, then normalize
For logits , softmax assigns the -th class the value
Here is approximately . The procedure has two parts. Exponentiation makes every numerator positive, even when a logit is negative. Normalization divides every numerator by the same sum, making the results add up to one.
Read the short softmax discussion in Dive into Deep Learning. Focus on why exponentiation and the shared denominator solve different parts of the problem.
Dive into Deep Learning explains the motivation for softmax, gives its formula, and shows why the largest logit retains the largest output value.
In Section 4.1.1.2, the softmax discussion immediately before “4.1.1.3. Vectorization,” begin at the paragraph opening “Another way to accomplish this goal.” Read the softmax explanation, stopping after the observation about the highest-probability class. Focus on the formula and the explanation of normalization; the subsequent discussion of temperature is not needed here.
The denominator uses all the logits. Consequently, each output depends on the whole list, not just on its corresponding score. The output vector has the same number of entries as the input vector: three class logits produce three class probabilities.
Calculating probabilities for one image
The supplied diagram shows three images processed separately. For the first image, the logits under cat, dog, and horse are .
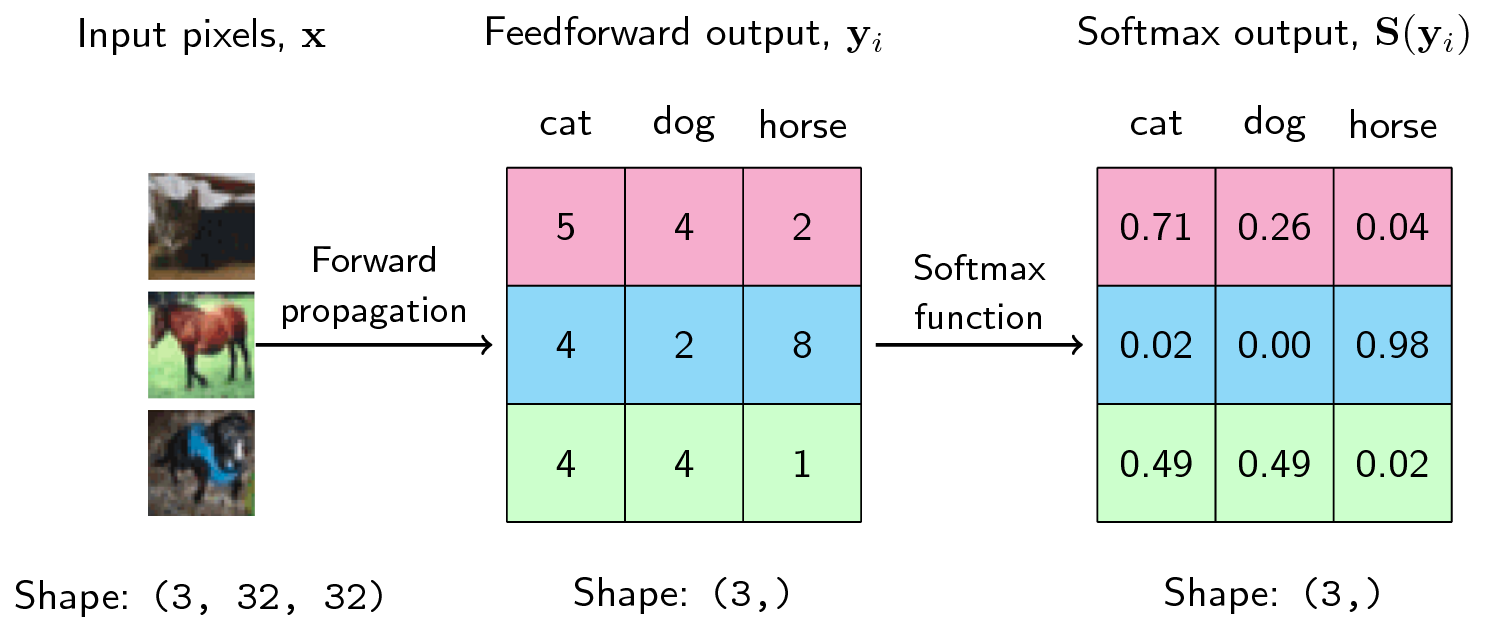
We could calculate , , and directly. A handier equivalent calculation subtracts the largest logit, , from every logit first:
Now exponentiate and add:
Divide each exponentiated value by this same sum:
The largest probability belongs to cat, as the diagram shows. Its displayed values add to only because each was rounded separately; the unrounded softmax values add to one.
Why was subtracting allowed? Subtracting the same constant from every logit leaves softmax unchanged:
Choosing as the largest logit also avoids calculating unnecessarily large exponentials. This is a numerical convenience, not a different function.
What the output does—and does not—say
Softmax preserves the ordering of logits: a larger logit gets a larger probability, and equal logits get equal probabilities. If all three logits are equal, all three outputs are . For any finite logits with at least two classes, each mathematical output is strictly between zero and one. Thus the diagram’s displayed for the dog probability on the second image means very small after rounding, not exactly zero.
These outputs form a probability distribution over the listed classes, provided those classes are the alternatives being considered. They are model-estimated probabilities, however: obtaining for cat does not by itself prove that the model’s confidence accurately reflects its real-world accuracy.
The connection to last lesson is now in view. If softmax turns scores into weights, those weights are nonnegative and sum to one. They can therefore be used to form a weighted average of vectors. In classification, we interpret the entries as probabilities over classes; later, attention will use the same operation to assign weights before combining value vectors.
Key takeaways
To convert logits into a probability distribution, exponentiate each logit, sum the exponentials, and divide each exponential by that shared sum. Softmax preserves which score is largest, while making the outputs positive and ensuring they sum to one. Subtracting the largest logit first changes neither the answer nor the class ranking.
Next lesson, you’ll use a predicted probability and the correct class to calculate cross-entropy loss for one classification example.