Recommended resources
The freely available resources this lesson will direct you to.
Hello! Welcome to your lesson on interpreting photoluminescence spectra.
In our last lesson, we explored how the Coulomb interaction between an electron and a hole leads to the formation of excitons, which manifest as discrete peaks in the optical absorption spectrum. Today, we turn our attention to the light emitted after absorption, a process you're familiar with from your experimental work: photoluminescence (PL).
Our goal is to learn how to interpret photoluminescence spectra by identifying features corresponding to band-to-band, excitonic, and defect-related transitions. By the end of this lesson, you will be able to look at a typical PL spectrum from a semiconductor and deduce the underlying physical processes responsible for the different emission peaks. This is a crucial skill for characterizing semiconductor materials and devices.
1. The Photoluminescence Process: From Excitation to Emission
Photoluminescence is fundamentally a three-step process:
- Excitation: A photon from an external source (like a laser) with energy greater than the material's bandgap () is absorbed, creating an electron-hole pair. This pair initially has excess kinetic energy.
- Thermalization: The "hot" electron and hole very rapidly lose this excess energy, typically on a sub-picosecond timescale. They do this by emitting phonons (lattice vibrations), relaxing down to the bottom of the conduction band and the top of the valence band, respectively. This rapid energy loss is why the emitted PL photons almost always have less energy than the absorbed excitation photons (a phenomenon known as the Stokes shift).
- Recombination: The electron and hole, now at the band edges, recombine. If this recombination results in the emission of a photon, it is a radiative process that we observe as photoluminescence. However, the pair can also recombine non-radiatively, with the energy being dissipated as heat (more phonons).
The efficiency of the PL process is quantified by the internal quantum efficiency (IQE), which is the ratio of radiative recombination events to the total number of recombination events (radiative + non-radiative).
For a quick overview of these fundamental concepts, the introduction from the following thesis is a good starting point.
PHOTOLUMINESCENCE SPECROSCOPY OF CdS AND GaSe NANOCRYSTALS EMBEDDED IN POLYMER THIN FILMS
This section from a Master's thesis provides a concise introduction to the basic principles of photoluminescence, outlining the three main stages and introducing the key recombination mechanisms.
Please read Chapter 3, sections 3.1, 3.2, and 3.3. Focus on the definitions of luminescence vs. photoluminescence and the description of the three phases (Excitation, Thermalization, Recombination). Section 3.3 provides a first look at the different recombination mechanisms, which we will explore in much more detail next.
2. A Guide to Radiative Recombination Channels
The specific energy of the emitted photon depends on the exact pathway the electron and hole take to recombine. Each pathway leaves a distinct fingerprint in the PL spectrum. A high-quality, detailed description of these channels is provided in the following resource. Given your advanced background, the depth of a PhD thesis should be both accessible and rewarding.
PHOTOLUMINESCENCE STUDY OF NON-POLAR III-NITRIDE SEMICONDUCTORS
This chapter from a PhD thesis on III-Nitride semiconductors provides an excellent, in-depth discussion of the various radiative recombination channels. It's particularly relevant given your own experience with luminescence spectroscopy. We will use this as our primary guide.
Please read section 1.2, 'Typical channels of radiative recombination' (starts around page 25). We will break it down piece by piece. For now, get a general sense of the different channels discussed: free electron-hole pairs, free and bound excitons, and defect-related transitions.
Let's now systematically dissect the features you might find in a PL spectrum, using the text you've just read as a reference.
a) Band-to-Band (e-h) Recombination
This is the most straightforward process, where a free electron in the conduction band recombines directly with a free hole in the valence band.
- Peak Energy: The emission is centered just above the bandgap energy, .
- Lineshape: As derived in section 1.2.1 of the resource LINK, the lineshape is asymmetric due to the thermal kinetic energy of the free carriers. At low temperatures, it's roughly proportional to . This gives the peak a characteristic high-energy "tail".
- Conditions: This transition is often weak in pure materials at low temperatures, where excitonic effects dominate. It becomes more prominent at higher temperatures (), where excitons are thermally dissociated into free carriers.
b) Excitonic Recombination
As we saw last lesson, excitons are often the lowest-energy electronic excitations. Their recombination is therefore a dominant channel in pure materials at low temperatures.
-
Free Excitons (FE): A free-moving exciton annihilates, emitting a photon.
- Peak Energy: Occurs just below the bandgap: , where is the exciton binding energy.
- Lineshape: A relatively sharp, symmetric peak (often Lorentzian or Gaussian). Any kinetic energy the exciton possesses can add a slight high-energy tail.
-
Bound Excitons (BE): A free exciton is captured by a neutral or ionized impurity (a defect) and then recombines.
- Peak Energy: Occurs at an even lower energy than the FE peak: , where is the energy required to "unbind" the exciton from the impurity.
- Lineshape: These peaks are typically very sharp and intense at low temperatures. The sharpness comes from the fact that the bound exciton is localized and has no kinetic energy. The intensity is enhanced by a phenomenon called "giant oscillator strength," making BE emission a very sensitive probe of even tiny impurity concentrations. Common notations include D⁰X (exciton bound to a neutral donor) and A⁰X (exciton bound to a neutral acceptor).
c) Defect-Related Transitions
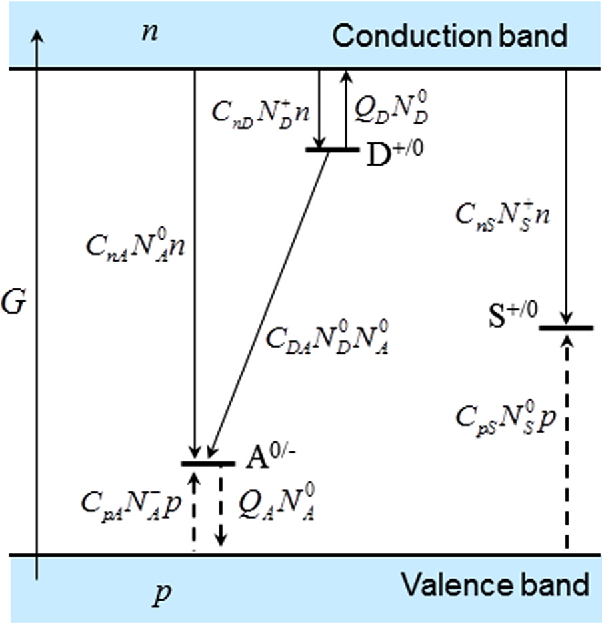
Impurities and defects introduce energy levels within the bandgap, opening up additional recombination pathways.
-
Free-to-Bound Transitions: A free carrier recombines with a carrier trapped at a defect.
- e-A⁰: A free electron from the conduction band recombines with a hole trapped at a neutral acceptor. Peak energy: .
- D⁰-h: An electron trapped at a neutral donor recombines with a free hole from the valence band. Peak energy: .
- Lineshape: Similar to band-to-band, these peaks have an asymmetric high-energy tail due to the kinetic energy of the free carrier.
-
Donor-Acceptor Pair (DAP) Recombination: An electron trapped on a donor recombines with a hole trapped on a nearby acceptor.
- Peak Energy: The energy depends on the spatial separation between the donor and acceptor due to their Coulomb interaction: .
- Lineshape: Since donors and acceptors can only occupy specific lattice sites, is discrete. In very high-purity crystals at low temperature, this can produce a series of sharp, distinct lines corresponding to different pair separations. More commonly, in doped samples, the random distribution of impurities smears these lines into a single broad peak.
- Key Signature: The recombination rate is faster for closer pairs. As you increase the excitation laser power, closer pairs recombine and saturate more quickly, causing the emission from more distant (and lower-energy) pairs to become relatively more important. This results in the DAP peak shifting to higher energy with increasing excitation power, a classic signature for this process.
Test your understanding!
You are studying a new semiconductor sample at low temperature (10 K). You observe a sharp peak at 2.150 eV and an even sharper, more intense peak at 2.145 eV. As you increase the temperature to 40 K, the 2.145 eV peak's intensity drops dramatically, while the 2.150 eV peak becomes relatively more prominent.
How would you tentatively assign these two peaks, and why?
Show answer
- Peak at 2.150 eV: This is likely the Free Exciton (FE) transition.
- Peak at 2.145 eV: This is likely a Bound Exciton (BE) transition.
Reasoning:
- Energy: The BE peak is at a lower energy than the FE peak (). The 5 meV difference corresponds to the localization energy of the exciton to an impurity.
- Lineshape/Intensity: BE peaks are typically sharper (localized, no kinetic energy) and can be more intense than FE peaks at low temperatures.
- Temperature Dependence: The rapid decrease in intensity ("thermal quenching") of the 2.145 eV peak is a classic signature of bound excitons. As the temperature increases, the thermal energy () becomes sufficient to break the weak bond between the exciton and the impurity (), releasing the exciton. This depletes the BE recombination channel.
d) Phonon Replicas
For transitions involving a localized state (like a bound exciton or a deep defect), the electronic transition can be accompanied by the emission of one or more phonons. This creates a series of "replicas" of the main electronic transition.
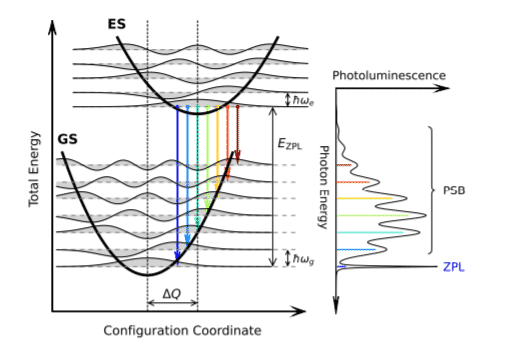
- Spectral Signature: You will see the main peak, called the Zero-Phonon Line (ZPL), followed by a series of smaller, often broader peaks on the low-energy side. These replicas are separated from the ZPL by multiples of the dominant phonon energy, which is typically the longitudinal optical (LO) phonon energy, . So you'll see peaks at , , and so on.
3. Case Study: Interpreting a Real Spectrum
Let's apply these ideas to a real PL spectrum. The resource LINK provides a clear analysis of the low-temperature PL from a Cadmium Sulfide (CdS) crystal.
PHOTOLUMINESCENCE SPECROSCOPY OF CdS AND GaSe NANOCRYSTALS EMBEDDED IN POLYMER THIN FILMS
Now we'll see how these concepts are used in practice. This section analyzes an experimental PL spectrum of CdS, assigning each peak to a specific recombination channel we've discussed.
Please read section 4.2 'PHOTOLUMINESCENCE PROPERTIES OF CdS' (starts on page 58). Look at Figure 4.1, which shows the spectrum. Then, follow the author's analysis as they identify peaks PL1 through PL5.
As you read, note how the authors use the principles we've covered to deconstruct the spectrum:
- The highest energy, dominant green peak (PL1 at 2.53 eV) is assigned to the free exciton.
- A nearby, lower-energy peak (PL2 at 2.41 eV) is assigned to a bound exciton.
- Two other peaks (PL3 and PL4) are assigned to free-to-bound transitions (conduction band to acceptor and donor to valence band).
- The final peak in the green band (PL5) is attributed to donor-acceptor pair recombination.
- A broad, low-energy red band (PL6) is attributed to a deep defect level.
This example beautifully illustrates how a single PL spectrum can contain a wealth of information about a material's electronic structure, excitonic properties, and defect landscape.
Conclusion
Today, we've built a powerful toolkit for interpreting photoluminescence spectra, a technique central to experimental condensed matter physics and materials science.
Key Takeaways:
- A PL spectrum is a composite of emission peaks from various radiative recombination channels.
- Band-to-band transitions produce a broad peak above with a high-energy thermal tail.
- Free exciton transitions result in a sharp peak at .
- Bound exciton transitions appear as very sharp, intense peaks at energies below the free exciton line and are highly sensitive to temperature.
- Defect-related transitions like free-to-bound and donor-acceptor pairs (DAPs) create peaks below the exciton features. DAPs are identifiable by their broad shape and characteristic blue-shift with increasing excitation power.
- Phonon replicas can appear as lower-energy sidebands to localized transitions, separated by the LO phonon energy.
Preview of the Next Lesson
So far in this module, we have focused on linear optical properties, where the material's response is proportional to the incident light intensity. In the next lesson, we will venture into the realm of nonlinear optics to explore second harmonic generation (SHG). You'll learn the physical mechanism by which a material converts two photons of a certain frequency into a single photon of double the frequency. This technique is a powerful probe of crystal symmetry, and understanding it will connect directly with your experimental experience with SHG measurements.