Recommended resources
The freely available resources this lesson will direct you to.
Hello. Last time, you examined how historical simulations, paleoclimate comparisons and model ensembles test different aspects of climate models. One distinction now matters for interpreting those tests: a simulation can fail to reproduce the date of a particular weather event yet still represent a long-term climate response well.
This lesson separates weather forecasts, which depend strongly on the observed starting state, from climate projections, which describe responses to assumed future influences. You will use that distinction to read a scenario plot and decide what would—and would not—count as evidence of model skill.
A weather forecast starts with the state of the atmosphere
Suppose you want to know whether it will rain at a particular place next Thursday. You need the best available estimate of today’s winds, temperatures, humidity and other conditions. A weather model advances that estimated state forward, using physical laws and information about influences such as the ocean surface. New observations are regularly incorporated to improve the starting state of subsequent forecasts. This is why weather forecasting is called an initial-value problem.
Watch how the following video presents that work, then how it changes scale when discussing climate simulations.
NASA | Supercomputing the Climate
Watch NASA | Supercomputing the Climate from NASA Goddard to contrast an observation-initialized weather forecast with simulations used to study longer-term climate change.
Watch weather forecasting for the account of observations, data assimilation and repeated forecast updates. Then watch climate simulations, focusing on the distinction between assembling a record of past conditions and simulating future changes.
An imperfect starting state limits the forecast. Atmospheric dynamics can amplify small initial differences, so two forecasts begun from slightly different plausible states may eventually depict different sequences of storms. Forecasters therefore often use ensembles and issue probabilities rather than insisting on one exact outcome. A forecast is not only about initial conditions—the model and its treatment of external influences matter too—but accurate initialization is essential to its central task: estimating the actual weather that will unfold from the present state.
The video also mentions a reanalysis, which combines a model with observations throughout a past period. That is useful for reconstructing what happened; it is not how a model acquires observations from 2050. Keeping reconstruction and future simulation separate prevents an easy misunderstanding of the video’s discussion of data assimilation.
A climate projection asks a conditional question
A different question is: How would average temperature change over coming decades if greenhouse-gas emissions followed a specified pathway? Here the future pathway is an input, not a result the physical climate model discovers. It may specify or imply changes in greenhouse gases, aerosols and land use. The model estimates the climate system’s response under those assumptions.
The IPCC glossary makes a careful distinction between prediction, projection and scenario. Read these entries together rather than treating “projection” as just a cautious synonym for “forecast.”
Annex II: Glossary | Climate Change 2022: Impacts, Adaptation and Vulnerability
Read the IPCC’s glossary definitions to establish exactly what is, and is not, assumed when a future climate result is called a projection.
In Annex II, find the adjacent entries “Climate prediction” and “Climate projection,” between “Climate model” and “Climate refugium.” Read climate prediction and climate projection. Then find “Scenario” immediately after “Salt-water intrusion/encroachment” and read its definition. Focus on why a plausible scenario is not itself a forecast of society’s choices.
In statistical terms, a long-range projection estimates a conditional response: what a model implies given a pathway. One concise way to express the question is
where is a temperature average over a specified future period and is an assumed scenario. This expression does not say that is likely to occur. Nor does it say every simulated year must equal that conditional average.
Different runs under the same scenario can begin from different plausible climate states. Their particular years and even decades will differ because of internal variability; averaging across runs helps reveal the response to the supplied influences. Conversely, running one model under different scenarios asks how its response changes when those influences change. The two comparisons answer different questions.
There is a useful qualification to the shorthand “forecast versus projection.” Climate simulations still have initial states, which can matter substantially for near-term and regional outcomes. Scientists also make initialized seasonal or decadal climate predictions that deliberately exploit knowledge of the current ocean–atmosphere state. “Climate” does not automatically mean “never a prediction.” The contrast here is between an initial-state-dependent forecast of actual evolution and a long-term projection conditional on a future scenario.
Reading a scenario plot without turning it into a forecast
The figure below shows historical global temperature change followed by results under several Shared Socioeconomic Pathways (SSPs). Its left temperature axis measures change relative to 1995–2014; the right axis uses a different reference period, 1850–1900. Check the axis before quoting a temperature change.
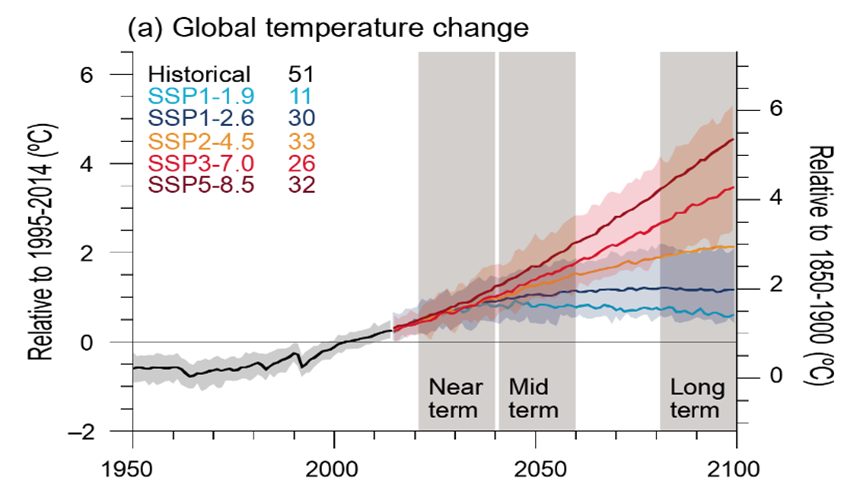
In the near term, the coloured trajectories remain relatively close. Later in the century, they separate markedly. That pattern is intelligible without assuming that the model somehow predicts future policy: the pathways prescribe differing future influences, whose cumulative effects increasingly differ. Shading around a trajectory also should not be read as a probability that its scenario will occur. To interpret any shaded range probabilistically, you would first need to know precisely how it was constructed.
Two statements about this plot have very different meanings:
- Conditional statement: “Under the SSP5-8.5 pathway, the plotted temperature change is much higher by 2100 than under SSP1-1.9.”
- Unconditional forecast: “The world’s temperature change in 2100 will follow SSP5-8.5.”
The figure supports the first statement. The second additionally requires an assessment of which emissions pathway will actually be followed. A physical climate simulation alone cannot settle that question.
This is also why the lines do not attempt to specify the exact weather on a date in 2100. A warm climate can still have cold days; the question represented by the plot concerns a changing temperature distribution and its long-term average, not the trajectory of one future day’s atmospheric state.
Match the test of skill to the claim
The forecast–projection distinction determines the appropriate error measure. For a weather forecast, you can compare predicted conditions with what occurred at the specified place and time. Across many forecasts, you can examine how accuracy changes with lead time and whether stated probabilities are well calibrated. Predicting a storm for Thursday when it arrives on Saturday is a meaningful timing error.
For a long-term climate projection, testing whether a simulated storm occurs on the same Thursday as an observed storm would usually test the wrong thing. Instead, ask whether the model reproduces the quantities relevant to its claim: for example, the response of multi-decade temperature to specified influences, changes in ocean heat content, or spatial patterns of warming. This connects directly to the historical and paleoclimate comparisons in the previous lesson. A model’s ability to capture a long-term response does not give it the initial-state information needed to reproduce each observed fluctuation.
Your econometrics background provides a precise way to see the issue. Consider the schematic decomposition
where is a response conditional on scenario , and includes internally generated variation. A large discrepancy in one year may reflect , not necessarily a bad estimate of . But that is not permission to dismiss every disagreement as noise: a persistent difference in long-run trend, or a systematic failure across several relevant variables, calls the modelled response into question. Serial correlation and other uncertainties also affect how confidently a trend difference can be judged.
There is a second condition for a fair historical comparison: compare against the influences that actually occurred, as well as they can be estimated. Imagine a model projection calculated under one specified emissions pathway, while subsequent emissions, aerosol changes or volcanic activity follow another. A difference between its plotted trajectory and observed temperature may partly reflect the difference in inputs. To evaluate the model’s physical response, simulations using the best available estimates of the realized influences are more informative than treating every scenario line as an unconditional prediction.
This does not make projections immune to testing. Historical simulations, prospective comparisons and process-level observations can all challenge a model. It means that a credible test states what was supplied to the model, what was predicted or projected, and which aspect of the outcome is being scored. As in the previous lesson, matching one global curve cannot establish skill for every region, variable or mechanism.
Conclusion
A weather forecast attempts to estimate actual future conditions from an observed starting state; its skill includes the timing and location of events. A climate projection estimates the response to specified future influences; its skill is judged principally against the relevant climate response, not the exact sequence of weather. Scenarios are assumptions used to examine possible futures, not probabilities supplied by the climate model. Initial conditions still matter for climate—especially nearer-term outcomes—but they play a different role in long-range, scenario-driven projections.
Next, you will examine a related challenge to model credibility: whether adjusting, or tuning, model components to improve agreement with observations makes subsequent model tests less convincing.