Recommended resources
The freely available resources this lesson will direct you to.
Hello! Last lesson, you checked array shapes before doing numerical operations. A tabular dataset has rows and columns too, but its columns may contain different kinds of values—and some entries may be missing or wrong. Before using data in a machine-learning experiment, you need to know what you have and what you changed.
In this lesson, you’ll load a CSV file with pandas, inspect its structure and contents, make deliberate cleaning decisions, and save the result. The example is small enough to run on your laptop. Allow about 40 minutes to work through the videos, reading, and code.
Load a table, not just an array
A pandas DataFrame represents a table with named columns and labeled rows. Unlike a typical NumPy array, one DataFrame can hold numbers, text, and dates in different columns. Here, each row represents one measurement; sample_id identifies it, while signal_a and signal_b are numerical measurements.
Watch the opening and inspection portions of Learn Pandas in 30 Minutes - Python Pandas Tutorial by Tech With Tim:
Learn Pandas in 30 Minutes - Python Pandas Tutorial
The video introduces DataFrames, CSV loading, and the quickest ways to inspect a new table.
Watch loading a CSV for the DataFrame concept and read_csv(). Then skip to initial inspection for head(), tail(), info(), and describe(). Focus on what each method reveals that a glance at the first rows cannot.
Create a small CSV locally so the example does not depend on a download. If pandas is not installed in your course environment, install it there before running the code.
from pathlib import Path
import pandas as pd

csv_text = """sample_id,signal_a,signal_b,measured_at,device,status
101,0.3,1.2,2025-01-02,A,ok
102,,2.4,2025-01-03,B,ok
103,0.8,999,2025-01-04,A,ok
104,0.5,1.8,not-recorded,B,ok
105,0.4,1.0,2025-01-06,,review
101,0.3,1.2,2025-01-02,A,ok
106,0.6,1.5,2025-01-07,A,ok
"""

Path("observations.csv").write_text(csv_text, encoding="utf-8")
raw = pd.read_csv("observations.csv")

print(raw.shape)       # (7, 6)
print(raw.head(3))
read_csv() interprets the first line as column names by default. The shape (7, 6) means seven records and six columns; it does not tell you whether those records are complete or valid. Keep raw unchanged as you investigate, so you can compare your cleaned data with the original.
Inspect what pandas inferred
A useful first pass combines a few complementary views:
print(raw.columns.tolist())
print(raw.tail(3))
raw.info()
print(raw.describe())
print(raw.isna().sum())
head() and tail() show example records, including whether problems occur near either end of the file. info() reports each column’s inferred data type and non-null count. Here, measured_at initially contains text, not actual datetime values. describe() summarizes numeric columns: its minimum and maximum can expose implausible values. isna().sum() counts missing entries by column.
Pay attention to two different problems in this example. The empty signal_a and device fields are read as missing values. But 999 in signal_b is a number as far as pandas is concerned; it will affect statistics until you identify it as invalid. Similarly, not-recorded is text, so it will not initially appear in the missing-value count for measured_at.
This image shows why a table view alone needs careful interpretation:
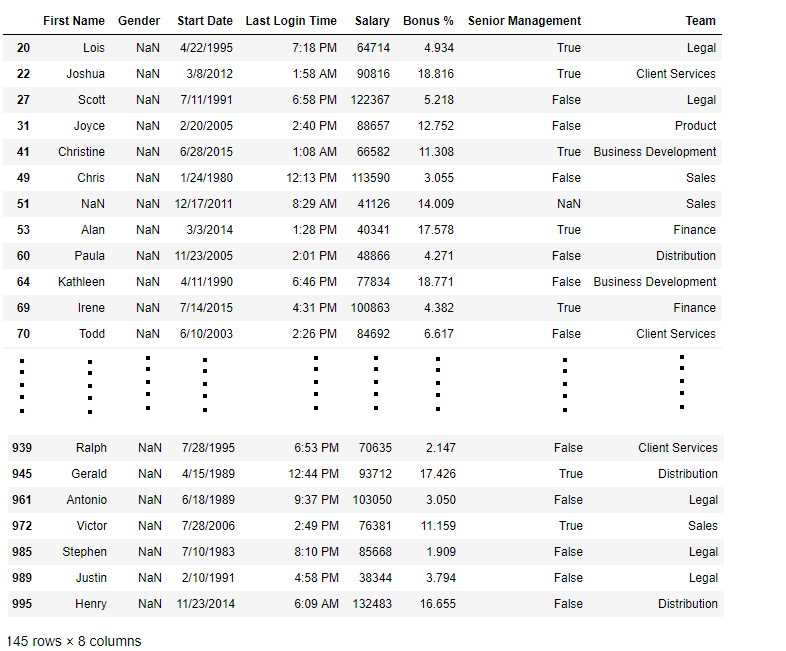
The displayed table reports 145 rows and eight columns, but shows only some of those rows. Its index labels are not a count of visible rows. You can see missing Gender entries in the excerpt, but you would need a column-wide check—not just the screenshot—to assess the complete dataset.
Decide what missing values mean before removing them
Pandas offers isna() to detect missing values, dropna() to remove rows or columns containing them, and fillna() to replace them. Read the Missing data section of the official 10 minutes to pandas guide for the mechanics:
10 minutes to pandas — pandas 2.3.3 documentation
The pandas documentation shows the core missing-value operations you will use in the cleaning recipe.
In “Missing data,” begin with missing-value operations. Continue through the isna() example immediately below that passage. Compare what dropna(), fillna(), and isna() return; notice that detecting a missing value is separate from deciding how to handle it.
The distinction matters because raw.dropna() would discard every row with any missing field, whether or not that field matters for the intended analysis. Filling every missing value with zero would be equally arbitrary: zero might be a genuine measurement.
The same video shows basic updates and missing-value operations:
Learn Pandas in 30 Minutes - Python Pandas Tutorial
Return to Learn Pandas in 30 Minutes for examples of changing values and handling missing entries.
Watch updates and cleaning. Note how loc, dropna(), and fillna() operate, but treat the choice to drop or fill as a question about the data, not a default command to copy.
For our example, suppose the measurement specification says signal_b must be between 0 and 5 and uses 999 to mean “no reading.” Also suppose a recorded date is required for the analysis we plan, but missing numerical readings can be retained by filling them with a typical observed value. Those assumptions determine the cleaning decisions; pandas cannot infer them from the CSV.
Check duplicates and values that only look valid
A duplicate can be an identical record entered twice—or two different records that happen to share an identifier. Do not treat those cases as interchangeable:
print(raw.duplicated().sum())  # 1 exact duplicate row

print(
    raw.loc[
        raw["sample_id"].duplicated(keep=False),
        ["sample_id", "signal_a", "signal_b", "measured_at"],
    ]
)

print(raw.loc[raw["signal_b"] > 5, ["sample_id", "signal_b"]])
print(raw.loc[raw["measured_at"] == "not-recorded"])
The two records with sample_id 101 are identical, so removing one is justified in this example. If their measurements differed, you would need to investigate rather than choose one automatically. The signal_b range check finds 999, which isna() missed. The date check finds the text that needs explicit handling.
Read Real Python’s discussion of Invalid Values and Inconsistent Values in Using pandas and Python to Explore Your Dataset:
Using pandas and Python to Explore Your Dataset – Real Python
Real Python illustrates why a non-missing value can still be unsuitable for analysis.
Within “Cleaning Data,” go to “Invalid Values” and read range and consistency checks through the end of “Inconsistent Values.” Focus on the difference between testing an allowed range and testing whether columns agree with each other.
A range check needs a defensible rule. We can reject 999 here because the example’s stated measurement specification defines the allowed range and sentinel. Without that information, an unusually large number would be a reason to investigate, not proof that it should be erased.
Apply and verify a cleaning recipe
The following code makes each decision visible. It removes the exact duplicate, interprets the sentinel and invalid date as missing, drops the record without a required date, and fills missing numerical measurements with the median of the remaining observed values. It uses "unknown" for a missing device label; that label means “not recorded,” not a newly discovered device.
clean = raw.drop_duplicates().copy()

# Interpret values according to the stated measurement specification.
clean["signal_b"] = clean["signal_b"].mask(
    clean["signal_b"] == 999
)
clean["measured_at"] = pd.to_datetime(
    clean["measured_at"],
    format="%Y-%m-%d",
    errors="coerce",
)

# Inspect which dates could not be parsed before removing those rows.
print(clean.loc[clean["measured_at"].isna(), ["sample_id", "measured_at"]])
clean = clean.dropna(subset=["measured_at"]).copy()

# Keep records with incomplete measurements; fill only those measurements.
for column in ["signal_a", "signal_b"]:
    clean[column] = clean[column].fillna(clean[column].median())

clean["device"] = clean["device"].fillna("unknown")
errors="coerce" converts an unparseable date to the missing-datetime marker NaT. Inspecting the affected rows before dropping them makes that conversion auditable. The median is calculated separately for each numerical column, using its non-missing values after the date-based removal. This is an introductory data-cleaning example, not yet a model-preprocessing pipeline: when you later build a predictive model, calculate fill values from the training data only so evaluation data cannot influence training.
Finally, verify the properties the recipe was meant to establish:
print(clean.shape)                 # (5, 6)
print(clean.isna().sum())          # zero in every column

assert clean["sample_id"].is_unique
assert clean["signal_b"].between(0, 5).all()
assert clean["measured_at"].notna().all()

clean.to_csv("observations_clean.csv", index=False)

reloaded = pd.read_csv(
    "observations_clean.csv",
    parse_dates=["measured_at"],
)
print(reloaded.shape)              # (5, 6)
The remaining DataFrame may have gaps in its row index because rows were removed. That is not missing data. index=False prevents pandas from writing those index labels as an extra CSV column; sample_id remains an ordinary data column. Reloading with parse_dates is necessary because a CSV stores text, not pandas datetime types.
What to take forward
A reliable first pass through tabular data is to load, inspect, investigate, clean, and verify. Use shape, head(), info(), and describe() to understand the table; use isna() and targeted checks to distinguish missing entries from invalid but non-missing values. Make drop, fill, and duplicate decisions based on what each column represents, then confirm the cleaned table satisfies those decisions.
Next, you’ll use Matplotlib to visualize data distributions and learning curves. Your inspection work here will help you recognize when a plot reflects the data—and when it reflects an unnoticed cleaning mistake.