Recommended resources
The freely available resources this lesson will direct you to.
Hello! Welcome to the first lesson in our new module, Graph Algorithms and Applications.
In the previous module, we concluded our deep dive into system resilience by looking at load shedding and other degraded response strategies. You learned how to design systems that can survive overload by making intelligent, prioritized decisions about which work to reject.
Now, we shift our focus to a new and powerful set of tools. Many complex problems in software engineering, especially in distributed systems, are fundamentally about relationships: dependencies, connections, conflicts, and flows. Graphs provide the mathematical language to describe these relationships precisely. This module is about mastering that language and the algorithms that operate on it.
Today's lesson is the crucial first step. Before we can solve any problem with a graph algorithm, we must first learn how to represent the problem as a graph. Our learning outcome is to model real-world problems such as task dependencies and resource allocation as graphs. We'll explore how to translate abstract requirements into the concrete structure of vertices and edges.
1. The Language of Graphs: A Quick Refresher
Let's begin by establishing a shared vocabulary. While you've likely encountered graphs before, a quick formal review will be helpful. A graph is a structure used to represent connections between objects.
Unveiling Graph Structures in Microservices: Service Dependency ...
This article, 'Unveiling Graph Structures in Microservices', provides a concise introduction to the formal definitions we'll use. It's written from a systems perspective, which aligns well with your background.
Please read the section titled 'Graphs and Adjacency Metrics'. Focus on the definitions of: Vertices (nodes) and edges Directed vs. Undirected graphs Weighted graphs \nThis will formalize the core components we'll use for modeling.
The key takeaway is that the art of modeling is deciding:
- What entities in my problem become the vertices?
- What relationships between those entities become the edges?
- Are the relationships directional (directed edges) or symmetrical (undirected edges)?
- Does the strength or cost of a relationship matter (weighted edges)?
Answering these questions is the essence of applying graph theory to practical problems.
2. Modeling Task Dependencies: The Directed Acyclic Graph (DAG)
One of the most common applications of graphs in software engineering is modeling tasks and their dependencies. This is directly relevant to your work on Rudi, which schedules inference tasks, and is also the foundation of build systems, CI/CD pipelines, and other workflow engines.
When Task B cannot start until Task A is complete, we say B depends on A. This is a directional relationship.
Topological Sort | Kahn's Algorithm | Graph Theory
Let's watch a brief, intuitive introduction to this concept. This video uses simple, everyday examples to show how ordered tasks form a directed graph.
Please watch from the beginning until 02:42. The video explains how tasks like getting dressed or compiling code can be modeled as a graph where edges represent prerequisites.
In these scenarios, the resulting graph has two critical properties:
- It is directed, because the dependencies flow in one direction (e.g., you compile code before you run tests).
- It is acyclic (contains no cycles), because a cycle would represent a logical impossibility—a task that depends on itself, creating a deadlock. For example, if Task A depends on B, and B depends on A, neither can ever start.
A graph with these properties is called a Directed Acyclic Graph (DAG).

This concept is so fundamental that it's formalized as a common parallel programming pattern.
Task Graph | Our Pattern Language
This document from UC Berkeley's Parallel Computing Lab describes the 'Task Graph' pattern. It's an excellent resource for understanding how to structure complex computations.
Please read the following sections: 'Problem' and 'Context': These sections formally define the problem of managing tasks with dependencies and introduce the DAG model. 'Examples': Focus on the hypothetical financial data analysis system and its corresponding graph (Figure 4). This shows a complete, non-trivial system modeled as a task graph. \nAs you read, consider how the scheduling logic in Rudi could be represented using this pattern. What are the 'tasks' (vertices) and what are the 'dependencies' (edges)?
3. Modeling Resource Allocation and Conflicts
Another class of problems involves assigning a limited set of resources to a number of entities that may have conflicts. Examples include scheduling exams into time slots (where two exams with the same student conflict), assigning frequencies to radio stations, or allocating registers in a compiler.
3.1. Conflicts as Edges: The Graph Coloring Model
Imagine you're scheduling final exams. Several courses need to be assigned to a limited number of time slots. The constraint is that if a student is in two courses, their exams cannot be at the same time. How do you find the minimum number of time slots needed?
This is a classic graph coloring problem.
- Vertices: Each course is a vertex.
- Edges: An undirected edge connects two vertices if there is a conflict between them (i.e., at least one student is in both courses).
- The Goal: Assign a "color" (a time slot) to each vertex such that no two adjacent vertices have the same color. The minimum number of colors needed is the minimum number of time slots required.
An Application of Graph Coloring
This video provides an excellent walkthrough of modeling exactly this exam scheduling problem.
Please watch from 02:28 to 10:38. The video demonstrates how to: Translate a table of course conflicts into a graph. Apply graph coloring to determine the minimum number of time slots. Adapt the solution to handle an additional constraint (the number of available rooms).
3.2. Requests and Allocations: The Resource Allocation Graph Model
A different but related problem is tracking which processes are using which resources and which are waiting for which. This is critical for detecting deadlocks in operating systems and distributed systems.
Here, we use a different kind of graph model, often called a Resource Allocation Graph.
- Vertices: There are two types of vertices: processes and resources.
- Edges: The edges are directed and represent either allocation or a request.
- An edge from a resource vertex to a process vertex means the resource is currently allocated to that process.
- An edge from a process vertex to a resource vertex means the process is requesting and waiting for that resource.
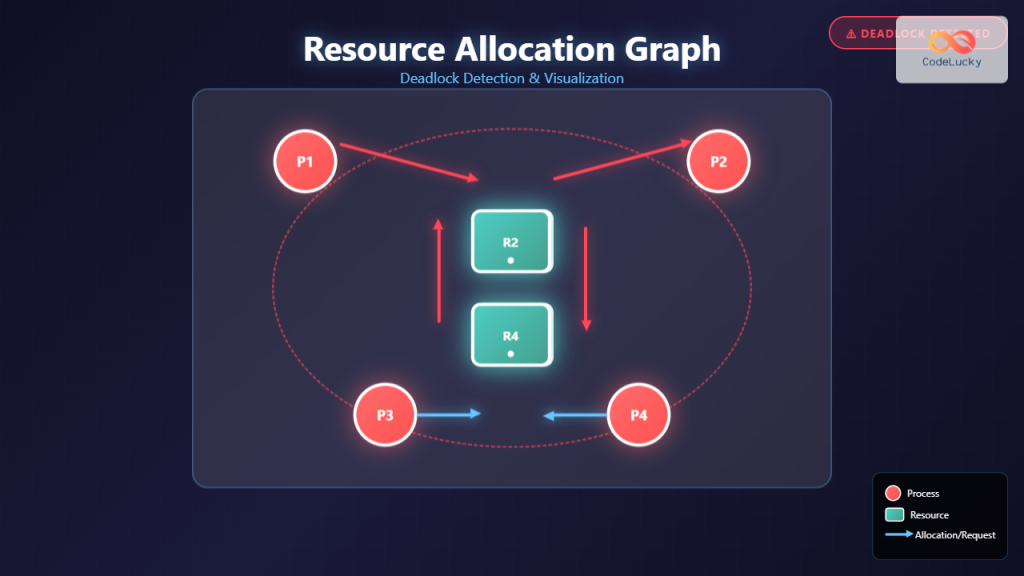
This model is a powerful diagnostic tool. If a cycle forms in the graph, it signifies a deadlock: a set of processes are each waiting for a resource held by another process in the set.
4. Application Spotlight: Modeling Microservice Architectures
Your experience at AWS makes modeling microservice systems a particularly relevant application. A complex system like Bedrock isn't a monolith; it's a web of interacting services. We can use graphs to understand this web.
Unveiling Graph Structures in Microservices: Service Dependency ...
Let's return to the 'Unveiling Graph Structures' article to see how these ideas apply at a system architecture level.
Please read the sections: 'Service Dependency Graphs': This describes a static view of your architecture. The nodes are services, and an edge from S1 to S2 means S1 depends on S2 to function. 'Service Call Graphs': This captures a dynamic, runtime view. The edges represent actual API calls, often weighted by latency or call frequency. \nNotice the trade-off: the Service Dependency Graph shows all potential dependencies, while the Call Graph shows what's actually happening in production.
This final example highlights a key principle: the way you model a problem depends on the question you want to answer. Are you analyzing static code dependencies for potential refactoring (Service Dependency Graph)? Or are you debugging a live latency issue (Service Call Graph)? The same system can be represented by different graphs to serve different purposes.
Conclusion
In this lesson, you learned the foundational skill of translating real-world problems into the formal language of graphs. This is the most critical step in applying graph algorithms effectively.
Key Takeaways:
- Modeling is about defining vertices and edges: The core of the process is deciding what entities become nodes and what relationships become links.
- Task Dependencies form DAGs: Problems involving prerequisites, build steps, or computational workflows are naturally modeled as Directed Acyclic Graphs.
- Resource Conflicts can be modeled with Graph Coloring: When you need to assign items to slots while respecting incompatibility constraints, you can model items as vertices and conflicts as edges.
- Deadlock Detection uses Resource Allocation Graphs: A directed graph with two types of nodes (processes and resources) is a classic way to visualize and detect deadlocks.
- The model depends on the question: The same system can be modeled in different ways (e.g., static dependency graph vs. runtime call graph) to answer different questions.
Next Lesson Preview
Now that you can frame a problem in terms of graphs, we can start solving it. In the next lesson, we will dive into two fundamental graph traversal algorithms: Breadth-First Search (BFS) and Depth-First Search (DFS). You'll learn how they work, implement them, and see how they form the basis for many more advanced graph algorithms.