Recommended resources
The freely available resources this lesson will direct you to.
Hello! Last time, you drew the request-routing workflow from form submission to a recorded assignment, follow-up, or review status. The chart made an important distinction visible: some requests follow a routine route, while others need a person to resolve missing information or an unclear topic.
A clear chart does not, by itself, make the workflow worth automating. In this lesson, you’ll score an opportunity on frequency, time savings, rule clarity, and operational risk. You’ll use the score to make a defensible first decision—not to promise that an automation will pay for itself.
Separate potential value from readiness
Frequency and time savings describe the potential benefit: how much repetitive work could be reduced. Rule clarity and operational risk describe whether it is sensible to automate that work now. A workflow can score highly on benefit and still be a poor candidate if its decisions are disputed or mistakes are difficult to correct.
This readiness diagram is a useful visual checklist. Notice that it asks about repeatable rules, exception rates, risk, and value before its human-review checkpoint.
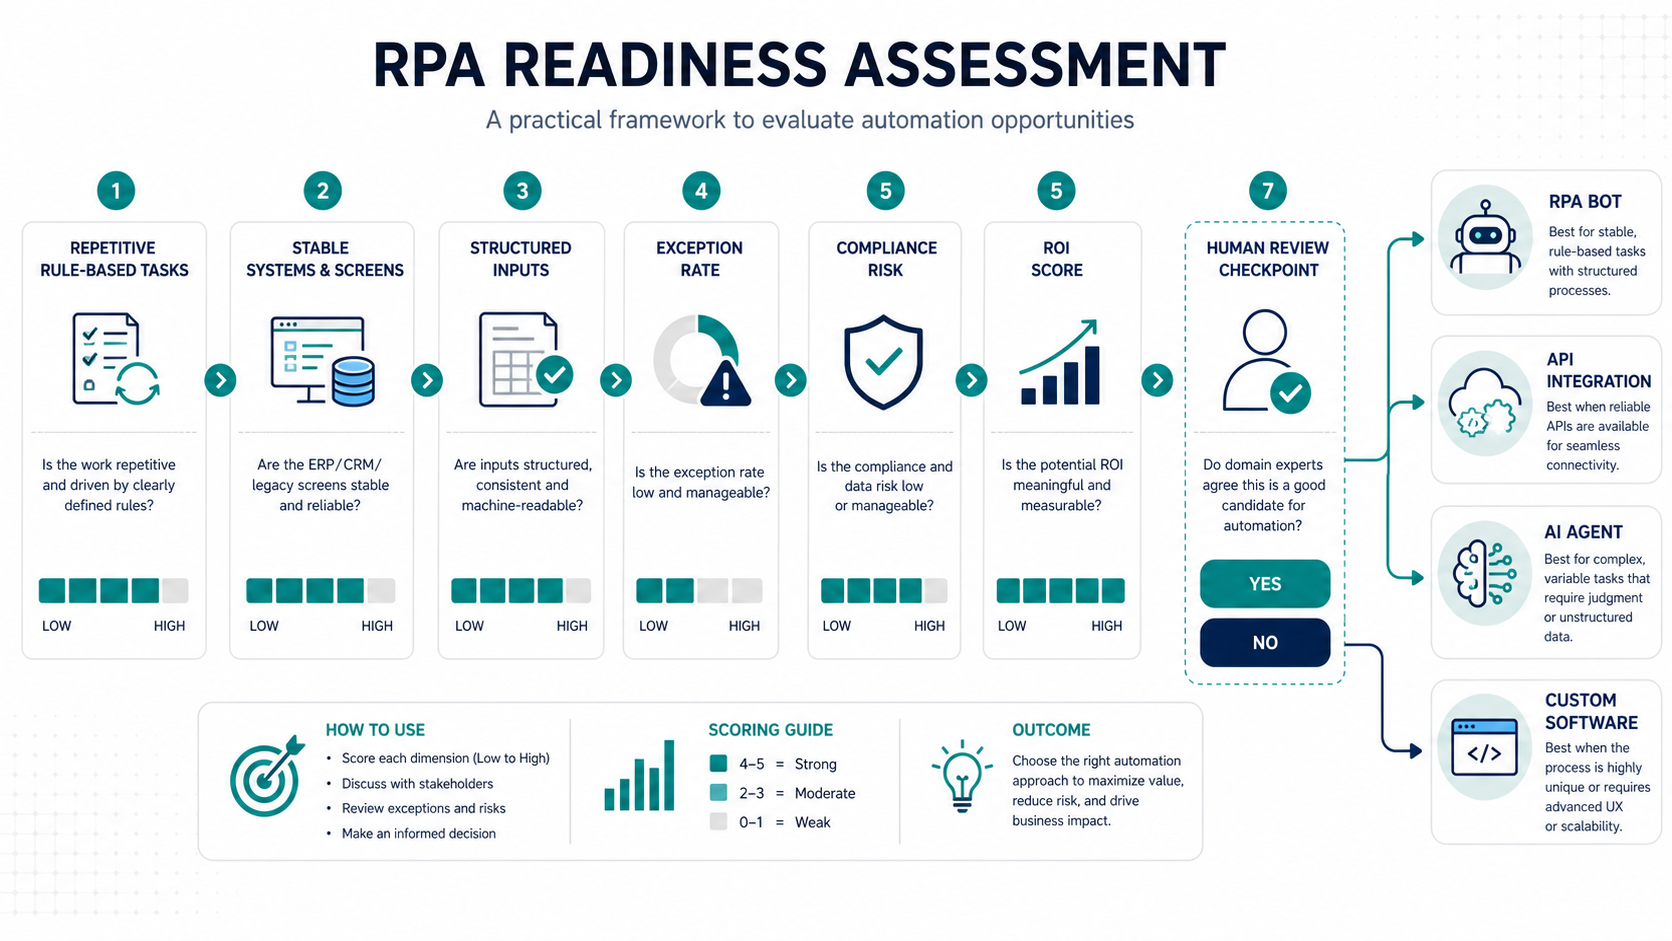
The diagram also suggests different technical solutions. You do not need to choose a tool yet. First decide which part of the mapped work, if any, merits a closer look.
Read the “Evaluation Dimensions” section of AI Workflow Automation Opportunity Map from InitializeAI. It uses more dimensions than our introductory scorecard, but its questions about volume, manual effort, input readiness, and risk will help you look beyond “this task feels repetitive.”
AI Workflow Automation Opportunity Map | InitializeAI
Read InitializeAI’s evaluation questions to see how potential value and practical readiness differ.
In “Evaluation Dimensions,” begin at “01 Workflow Volume” and read through “08 Risk & Oversight,” stopping before “09 Measurement Clarity.” Read the evaluation questions, paying particular attention to “02 Manual Effort,” “05 Data/Input Readiness,” and “08 Risk & Oversight.” Treat the other dimensions as context; you will score only four factors today.
One caution matters when estimating value: count the cases you might actually automate, not every case that enters the workflow. In our request chart, a submission with no description cannot be routed by the ordinary topic rules. An unclear description still needs intake review. Those cases may benefit from a recorded exception path, but you should not claim that their manual handling time disappears.
Build a four-factor scorecard
Use a 0–3 score for each factor. The thresholds below are a starting convention for comparing opportunities, not universal industry standards. Keep the same thresholds when comparing workflows, and record the evidence behind each score.
| Factor | 0 | 1 | 2 | 3 |
|---|---|---|---|---|
| Frequency: eligible cases per month | Fewer than 20 | 20–49 | 50–99 | 100 or more |
| Time savings: minutes saved per eligible case | Less than 1 | At least 1, but less than 3 | At least 3, but less than 6 | 6 or more |
| Rule clarity | No agreed way to decide routine cases | Frequent cases require undocumented judgment | Most routine decisions are documented; unclear cases have an exception route | Routine decisions are explicit and can be checked against examples; exceptions have a route |
| Operational risk, scored as manageability | A consequential error has no credible control | Substantial consequences; controls are uncertain | Consequences are limited or can plausibly be contained by specified review and correction | Errors have low impact, are easy to detect, and are reversible |
Higher is better on all four rows. In particular, a risk score of 3 means low or readily manageable risk, not “very risky.”
To estimate per-case time savings, compare the current handling time with the time a person would still spend checking or correcting an automated case:
This is a gross effort estimate, not a financial return. Building, monitoring, and maintaining the automation also take time; the number of monthly hours saved may be too small to justify that work.
Rule clarity deserves a closer look because a tidy flowchart can conceal a vague decision. A question such as “Billing topic?” is useful only if the people doing the work can apply an agreed rule to realistic descriptions. RPA for Enterprise: A Practical Implementation Guide makes the distinction between recurring work and work governed by describable rules.
RPA for Enterprise: A Practical Implementation Guide | FYI Solutions
Read the “Step 1 — Process Discovery and Prioritization” paragraph for its test of whether repeatable work is also ready for rule-based automation.
Under “The Implementation Roadmap,” find “Step 1 — Process Discovery and Prioritization.” Read the full paragraph, from that opening sentence through its warning about unstable rules and irregular frequency. Focus on its distinction between a decision tree and a decision that still depends on judgment. Its comments about digital inputs and screen stability are particularly relevant to screen-operated bots; they are not requirements for every kind of automation.
Watch the selected parts of SolveUnsolved’s RPA Feasibility Analysis for a worked approach to comparing process characteristics. The video uses a broader feasibility matrix than ours. Focus on what information is scored and why; do not substitute its final index for the four scores defined above.
RPA Feasibility Analysis | How to calculate process feasibility | Feasibility matrix | RPA Tutorial
Watch SolveUnsolved’s “RPA Feasibility Analysis” to see how separate process, technical, and value judgments can be brought together without treating volume alone as the answer.
Start with scoring categories for the structure of a feasibility assessment. Then watch technical feasibility, especially where human judgment affects suitability. Continue with volume and time for frequency and handling-time inputs, and combined scores to see how an overall assessment is formed.
Score the request-routing workflow
Suppose observation of the current request workflow gives you these provisional figures:
- 120 submissions per month arrive.
- 90 have the fields and sufficiently clear topics needed for a routine route. The other 30 still need manual follow-up or intake judgment.
- For an eligible request, manual inspection, routing, and recording currently take 6 minutes. The proposed workflow would still require an estimated 2 minutes of checking and occasional correction, leaving 4 minutes saved per eligible request.
The frequency score is 2, because 90 eligible cases fall in the 50–99 range. The time-savings score is 2, because the estimate is 4 minutes per eligible case. Together, those estimates imply:
That is 6 gross staff-hours per month, if the proposed handling time proves realistic. Counting all 120 submissions as fully automated would overstate the benefit: the 30 exception cases still require attention.
Next, score the decisions shown in your chart. Required-field checks and the stated routing order are clear, but descriptions at the boundary between topics may still need a person’s judgment. Because the chart gives unclear topics an intake-review route, rule clarity is 2, rather than 3. If staff cannot agree on what counts as a technical versus billing request even in common cases, reduce that score to 1 until the rule is clarified.
Finally, consider a wrong route. It might delay a response, but the proposed workflow records its disposition, leaves unclear topics with a reviewer, and allows an assignment to be corrected. Operational risk is provisionally 2, provided an owner will check misroutes and the correction route is workable. Without those controls, a lower score would be more honest.
| Opportunity | Frequency | Time savings | Rule clarity | Risk manageability | Total |
|---|---|---|---|---|---|
| Routine request routing, with exceptions retained for review | 2 | 2 | 2 | 2 | 8/12 |
A useful screening rule is to consider scores of 8–12 for a small pilot only if both rule clarity and risk manageability score at least 2. Scores of 5–7 call for investigation or redesign; 0–4 suggest deferring the opportunity. These bands are a decision aid, not proof of return on investment. For request routing, an 8/12 supports investigating a limited, supervised pilot, while six estimated hours per month makes implementation effort an important question.
The minimum scores prevent a misleading total from settling a safety question. Imagine a high-volume workflow with scores of 3 for frequency, 3 for time savings, 3 for rule clarity, and 0 for risk manageability. Its total is 9/12, yet a consequential error without a credible control rules out an unattended pilot. Conversely, a rare, low-risk task might also total 9/12 because its rules are excellent and it saves considerable time per case; at only eight cases a month, its total monthly benefit could still be modest. Use the component scores and the hours estimate alongside the total.
What makes a score credible?
A score is most useful when another person can trace it back to observations. For frequency, note the month counted and how you excluded ineligible cases. For time, note how many cases were timed and whether the proposed checking time is measured or assumed. For clarity, record which decisions staff agree on and which descriptions still cause disagreement. For risk, name the possible error, its consequence, who would notice it, and how it could be corrected.
Estimates are acceptable at this stage—unmarked assumptions are not. A first score might say “90 eligible cases, estimated from one month of records” and “2 minutes of checking, not yet tested.” That makes the next investigation clear. The following lesson will turn a promising opportunity into a measurable success criterion: a result you can check after a pilot rather than a hope that automation will help.
Key takeaways
Score the eligible portion of a workflow, not just its total volume. Estimate time saved after remaining human work, check whether routine rules are genuinely clear, and score risk according to the consequences of mistakes and the controls available. A total helps compare opportunities, but weak rules or unmanaged risk should not be hidden inside a strong aggregate score.