Recommended resources
The freely available resources this lesson will direct you to.
Hello! In the previous lesson, you chose change policies for individual dimension attributes. A Type 2 customer category, for example, lets an old order retain the category that applied when it was placed. The next design question is broader: if orders, shipments, and invoices each use customer data, will “customer category” mean the same thing across all three?
This lesson connects individual stars into an enterprise design. You’ll construct a bus matrix, use it to identify dimensions that must be conformed, and specify when measures in different fact tables can legitimately share a definition. The result is a plan for integrated reporting, not an instruction to put every process in one fact table. Estimated study time: about 40 minutes.
Why several correct stars can produce inconsistent reports
Suppose an order mart calls a product “Home Audio,” while an inventory mart classifies the same product as “Electronics.” Each star may be internally sound. Yet a report comparing orders with stock by product category will give an unreliable answer: its grouping labels do not refer to the same sets of products.
The bus architecture addresses this integration problem. Separate business processes retain separate facts and grains, while reusable, agreed-upon dimensions provide common analytical descriptions. Watch Bus Architecture from LeapFrogBI for a visual explanation. Its sales-and-inventory example is particularly useful: a shared product label matters because analysts want to compare two different measurements by the same product.
Bus Architecture by LeapFrogBI introduces the bus matrix as a planning view of multiple dimensional models. Watch for the distinction between connecting marts conceptually and combining their fact rows physically.
Watch shared products for the sales-versus-inventory example. Continue with the matrix: around 00:03:24, dimensions appear as columns and business processes as rows. Notice that an intersection records where a dimension applies; it does not establish that two implementations are already consistent.
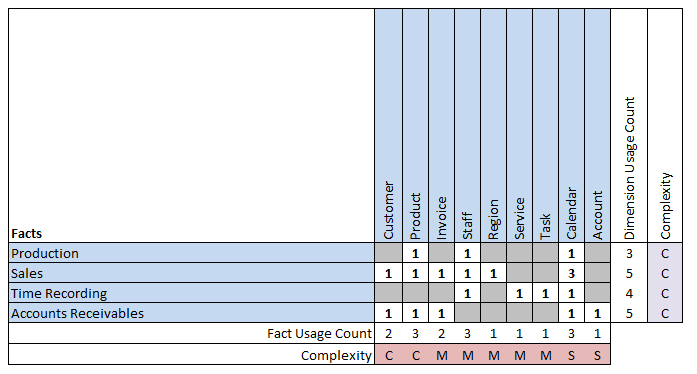
The picture below is another example of that planning view. Read across a process row to see candidate dimensions; read down a dimension column to see where a shared definition would matter. The usage counts suggest areas deserving coordination, not proof that the underlying dimensions conform.
Construct the first matrix at business-process level
A useful row names an activity that generates measurements: taking orders, shipping goods, or receiving payments. “Sales department” is too broad; “monthly report for the sales director” is too narrow. A useful column names a coherent descriptive dimension, such as Product, rather than an individual attribute such as product_category.
Read Margy Ross’s The Matrix: Revisited from Kimball Group for the architectural rules behind those choices. As you read, distinguish the candidate intersection in a draft matrix from the harder work of establishing an agreed dimension definition.
The Matrix: Revisited - Kimball Group
Margy Ross’s Kimball Group article explains how process rows and conformed-dimension columns make a bus matrix useful for both design and coordination.
In “Matrix Columns for Reference Data,” begin with “Delving into bus matrix fundamentals” and read the columns, focusing on agreed attribute meanings. In “Data Stewardship Required,” start with “In our experience, the most effective data stewards” and read stewardship. In “Process-Centric Rows,” start with “While the matrix columns refer to the business” and read the rows. In “Associate Matrix Columns and Rows,” find the paragraph beginning “Once you’ve determined several dozen core processes”; from its sentence about shading cells, read the intersections. Finally, in “Common Matrix Mishaps,” begin at “Row mishaps commonly fall into the following two categories” and read the pitfalls through the end of the column-level cautions.
Consider this proposed matrix for an order-to-cash and inventory environment. Each mark means that the process has a meaningful relationship to that dimension at its stated grain. A dash means that the dimension does not directly describe the process’s measurement.
| Business process | Date | Product | Customer | Warehouse |
|---|---|---|---|---|
| Taking orders | Order date | SKU | Sold-to customer | — |
| Shipping order lines | Ship date | Shipped SKU | Sold-to customer | Shipping warehouse |
| Invoicing lines | Invoice date | Invoiced SKU | Billed customer* | — |
| Recording month-end inventory | Snapshot date | Stocked SKU | — | Stock-holding warehouse |
| Receiving payments | Payment date | — | Paying customer* | — |
*The two customer labels require a business decision: are sold-to, billed, and paying customer the same business identity in these processes? If not, they may be distinct roles or dimensions. Do not mark them “conformed” merely because all three source columns are named customer_id.
The matrix also makes absences informative. A payment generally does not have a product at its own grain; adding Product just to make its row resemble Invoicing would invite an unjustified allocation. An order may have a requested fulfillment site, but the example leaves Warehouse blank because that assignment has not been established at order time. A blank cell is preferable to an unsupported relationship.
What makes a dimension conformed?
A repeated column heading in the matrix identifies a conformance requirement. To fulfill it, the participating models must use compatible business identities and descriptive attributes wherever they claim to share that dimension. For Product, settle questions such as:
- Does a product row identify a SKU, a brand, or something else? Are discontinued SKUs retained?
- Do the same category names identify the same groups of SKUs in orders, shipments, invoices, and inventory?
- Which classification changes restate history, and which retain Type 2 versions?
- How are source product identifiers matched when the processes originate in different systems?
This does not require every process to have every Product attribute. An inventory analysis might need an appropriate subset of the shared Product attributes. But its retained attributes and members must have compatible meanings at the level used for comparison. A brand-level forecast, for instance, could use a conformed brand-level view of Product without pretending that its forecast rows identify individual SKUs.
The previous lesson’s SCD decision matters here. Suppose orders and invoices both report customer category at the time of their respective events. A Type 2 category policy and reliable effective-time key resolution must be coordinated across them. Reusing the text “Gold” while one mart retrospectively overwrites categories and the other preserves historical versions does not give analysts a consistent historical comparison. Conversely, reports explicitly comparing today’s customer classification may need a separately defined current-state perspective.
Conformance is a business and data-engineering contract, not just a shared table name or a matching integer key. If marts hold separate physical copies, their warehouse surrogate keys need not be numerically identical; the governed business identity, classifications, history rules, and mappings must still produce compatible results. This is why stewardship appears in Ross’s article: an ETL transformation can implement a category rule, but it cannot decide which competing category rule the business intends.
Conformed facts: align meaning without merging events
The standard bus matrix has dimensions as columns. It does not claim that every number appearing in adjacent process rows is the same fact. You must separately identify candidate conformed facts: measures intended to carry the same name, definition, unit, and aggregation rules wherever they are used.
For example, quantity_ordered, quantity_shipped, and quantity_invoiced may all be counts of units, yet they measure different events. A partially shipped order can legitimately have 10 units ordered, 7 shipped, and 7 invoiced. Calling each quantity hides a useful distinction; forcing them into one fact table would erase their different grains. They can be compared after each has been summarized to compatible dimensions.
By contrast, if two invoicing fact tables both expose net_invoiced_amount, the name can be shared only after agreeing what it includes. Does it subtract discounts? Are taxes excluded? How are credit notes signed? Is the value in invoice currency or a specified reporting currency? Is it an amount for one invoice line in both tables? A shared spelling is insufficient when those answers differ.
A compact definition for a candidate conformed fact might read:
Net invoiced amount: signed invoice-line amount after line discounts, excluding tax, expressed in the agreed reporting currency; credit lines are negative. It is summed across invoice lines, subject to the stated currency-conversion and history rules.
That contract is more useful than simply adding “Net Revenue” to a diagram. It also tells you when not to reuse the name: a payment amount represents cash received, not net invoiced revenue, even if the totals happen to match in one month.
Add detail only where the matrix needs it
An enterprise matrix deliberately stays small enough to discuss. When implementation begins, one process row may require more than one fact table. For example, shipping might have an atomic shipment-line fact and a daily snapshot of outstanding shipments. They need separate grain statements even though both belong to the shipping process.
Read Design Tip #41: Drill Down into a More Detailed Bus Matrix, also by Margy Ross for Kimball Group, to see how to expand a process row into fact-table rows without turning the enterprise matrix into a list of reports.
Design Tip #41: Drill Down into a More Detailed Bus Matrix - Kimball Group
This short Kimball Group design tip shows when a high-level process row should be expanded into individually specified fact tables.
In the paragraph after the article’s opening, begin “While the matrix provides a high-level overview” and read why expand. In the next paragraph, start “We can alter the matrix’s” and read how to expand through the end of the article’s main text. Focus on the additional fact grain, facts, and dimension-detail annotations, rather than making a new column for every level of Product.
Here is a small detailed extension of two rows from our example:
| Fact table | Declared row grain | Candidate measures | Product level |
|---|---|---|---|
fact_shipment_line |
One product line in one shipment | Units shipped | SKU |
fact_inventory_month_end |
One SKU in one warehouse at month end | Units on hand | SKU |
Both can use governed Product and Warehouse descriptions. Their quantities still have different aggregation rules: units shipped can be summed across shipment dates, while adding month-end units on hand across successive months would not produce a meaningful stock level. The matrix exposes the shared dimensions; the detailed row notes prevent the shared dimensions from obscuring this distinction.
The safe boundary for cross-process analysis
Suppose one customer has two invoice lines of 100 each and makes one payment of 200 in the same month. Joining raw invoice lines directly to raw payment rows on customer and month attaches the payment to both lines. A report would incorrectly show 400 received, despite only 200 being paid.
For a monthly comparison, first total invoice amounts by conformed customer and invoice month. Separately total payment amounts by conformed customer and payment month. Then align those two monthly result sets by customer and month. The result correctly shows 200 invoiced and 200 received. It does not prove that this particular payment settled those particular invoices; that requires an explicit payment-application relationship.
This is the practical promise—and limit—of the bus matrix. It identifies where common analytical coordinates exist. It does not remove the need to respect each fact’s grain, event date, and business meaning when combining results.
Conclusion
A bus matrix gives you an enterprise plan in one view: process rows, candidate conformed-dimension columns, and marked relationships between them. A mark creates work to agree on identities, attributes, and history policy; it does not certify conformance. Define conformed facts separately, with explicit event meaning, units, calculation, and aggregation rules. When processes have different grains, retain separate fact tables and compare suitably aggregated results rather than joining raw facts together.
You have now carried dimension-design decisions across processes. In the next module, you’ll apply these shared definitions to more demanding fact-table patterns, beginning with periodic snapshots such as inventory balances.