Recommended resources
The freely available resources this lesson will direct you to.
Hello! Welcome to the third lesson in our "Advanced Network Analysis" module.
In our last session, we explored how browsers prioritize and queue network requests. We learned how to analyze this behavior and influence it using the Fetch Priority API to optimize loading performance. This is especially critical on constrained networks.
Today, we'll focus on how to reliably simulate those constrained networks. While you might be familiar with the generic "Slow 4G" or "3G" presets, real-world connections are far more varied. This lesson will teach you how to move beyond these presets and configure custom network throttling profiles to simulate specific connection conditions, giving you more power and accuracy in your performance testing.
Beyond the Presets: Why Custom Profiles Matter
The built-in throttling presets are a great starting point, but they represent broad averages. A user on a conference Wi-Fi might have low latency but heavily restricted bandwidth. Another user on a satellite connection might have high bandwidth but very high latency. Neither scenario is perfectly captured by "Slow 4G."
To create meaningful custom profiles, it's helpful to first understand what the presets actually represent.
Network Throttling in Chrome DevTools
The article 'Network Throttling in Chrome DevTools' by DebugBear provides a clear breakdown of the values behind the generic preset names. This will give us a baseline for our custom configurations.
Please read the subsections Latency settings and Bandwidth settings. Pay attention to the specific values for download/upload speed and latency for the 'Fast 4G', 'Slow 4G', and '3G' presets.
As you can see, the presets are just named combinations of three key parameters:
- Download speed: How quickly data is received from the server.
- Upload speed: How quickly data is sent to the server.
- Latency: The delay for a round-trip communication with the server.
When your target audience's network conditions don't match these specific combinations, it's time to create a custom profile.
Creating and Using a Custom Throttling Profile
Let's walk through creating a profile to simulate a specific user scenario. Imagine you're developing a feature for users in a location with developing infrastructure, characterized by decent mobile bandwidth but high latency. For example, 5 Mbps download, 1.5 Mbps upload, and 150ms of latency.
The process to create this profile is straightforward.
The official Chrome documentation outlines the steps to add a new custom profile directly from the Network panel.
Read the short section titled Create custom throttling profiles. This will guide you to the settings menu where you can add a new profile.
Following those steps, you'll arrive at the settings page where you can define your profile.
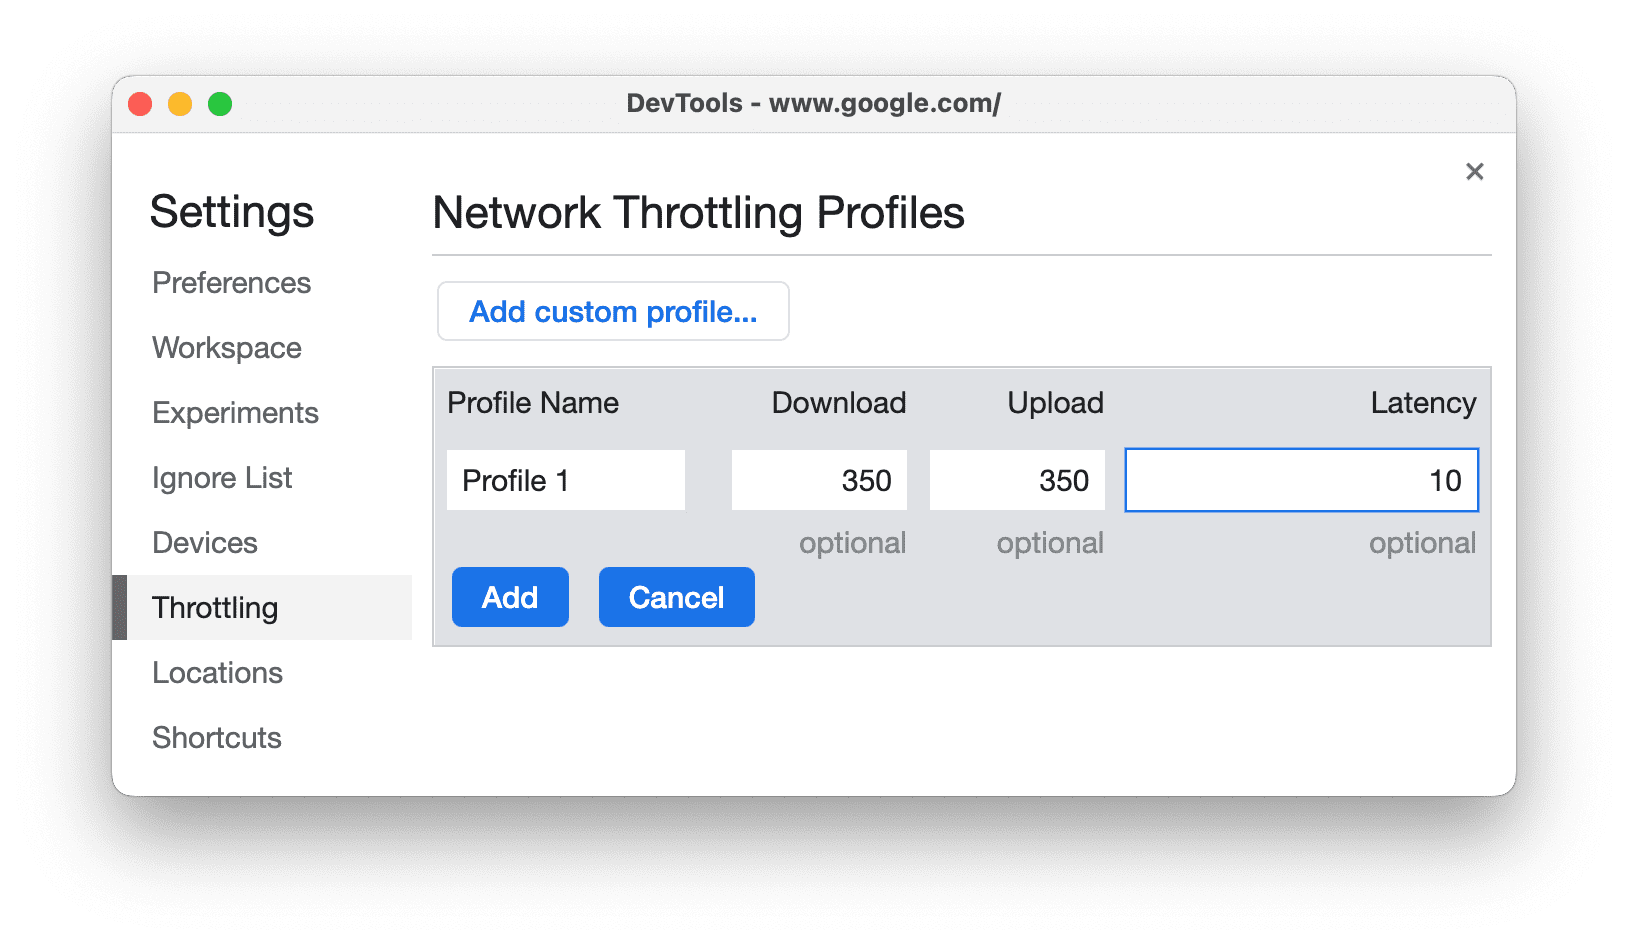
Try it yourself:
- Navigate to DevTools Settings > Throttling.
- Click Add custom profile....
- Create the "Developing Infrastructure" profile we described:
- Profile Name:
Developing Infrastructure - Download:
5000kbit/s (which is 5 Mbit/s) - Upload:
1500kbit/s (which is 1.5 Mbit/s) - Latency:
150ms
- Profile Name:
- Click Add.
Now, you can return to the Network panel, open the throttling dropdown, and select your newly created Developing Infrastructure profile to test your site under these specific conditions.
Under the Hood: How DevTools Throttling Actually Works
Creating profiles is easy, but to truly master this tool, it's essential to understand its implementation and limitations. Your background in radiophysics gives you a solid foundation for appreciating the difference between a simulation and physical reality, and the same principle applies here. DevTools throttling is a request-level simulation, not a true network-layer (packet-level) one. This has important consequences.
The following resource provides an excellent explanation of these nuances.
Network Throttling in Chrome DevTools
Let's return to the DebugBear article to understand the mechanics of DevTools throttling. This will clarify what is and isn't being simulated.
Please read the section How exactly does DevTools network throttling work?. Focus on two key points: How latency is applied (as an added delay after a response is received). The limitations of bandwidth throttling (dividing bandwidth equally, not by priority).
Let's summarize the crucial points from that reading:
- Latency is an added delay: DevTools doesn't actually slow down the network packets for DNS, TCP, and SSL negotiations. The request is sent at full speed. Once the response headers are received, DevTools simply waits for an artificial amount of time before making the response available to the renderer, ensuring the total time meets the specified latency. This means it disproportionately slows down subsequent requests on an already established connection compared to how a real high-latency network would behave.
- Bandwidth is divided equally: When multiple requests are in flight, DevTools divides the simulated bandwidth equally among them. This ignores the request priorities we discussed in the last lesson. In the real world, a browser might allocate more bandwidth to a
Highestpriority CSS file than aLowpriority image. DevTools' simulation doesn't reflect this, which can sometimes give a misleading picture of the load order.
Knowing these limitations doesn't invalidate the tool; it allows you to interpret its results with the proper context.
Test your understanding!
You are testing a page that loads a critical CSS file and several non-critical images simultaneously. You are using a custom throttling profile with a very low bandwidth limit.
Based on your understanding of DevTools' throttling model, how might the simulated waterfall chart in DevTools differ from what a real user on an identically slow network would experience?
Show answer
In the real world, the browser would assign the CSS file a Highest priority and the images a Low or Lowest priority. It would likely dedicate most of the scarce bandwidth to downloading the critical CSS file first, finishing it relatively quickly before moving on to the images.
In the DevTools simulation, the limited bandwidth would be divided equally among the CSS file and all the images. This means the critical CSS file would take much longer to download than in the real-world scenario because it's competing for bandwidth with low-priority resources. Consequently, the simulated Time to First Render might appear significantly worse than it actually is for a real user.
Advanced Throttling Parameters
For even more specific simulations, newer versions of Chrome expose advanced options like packet loss.
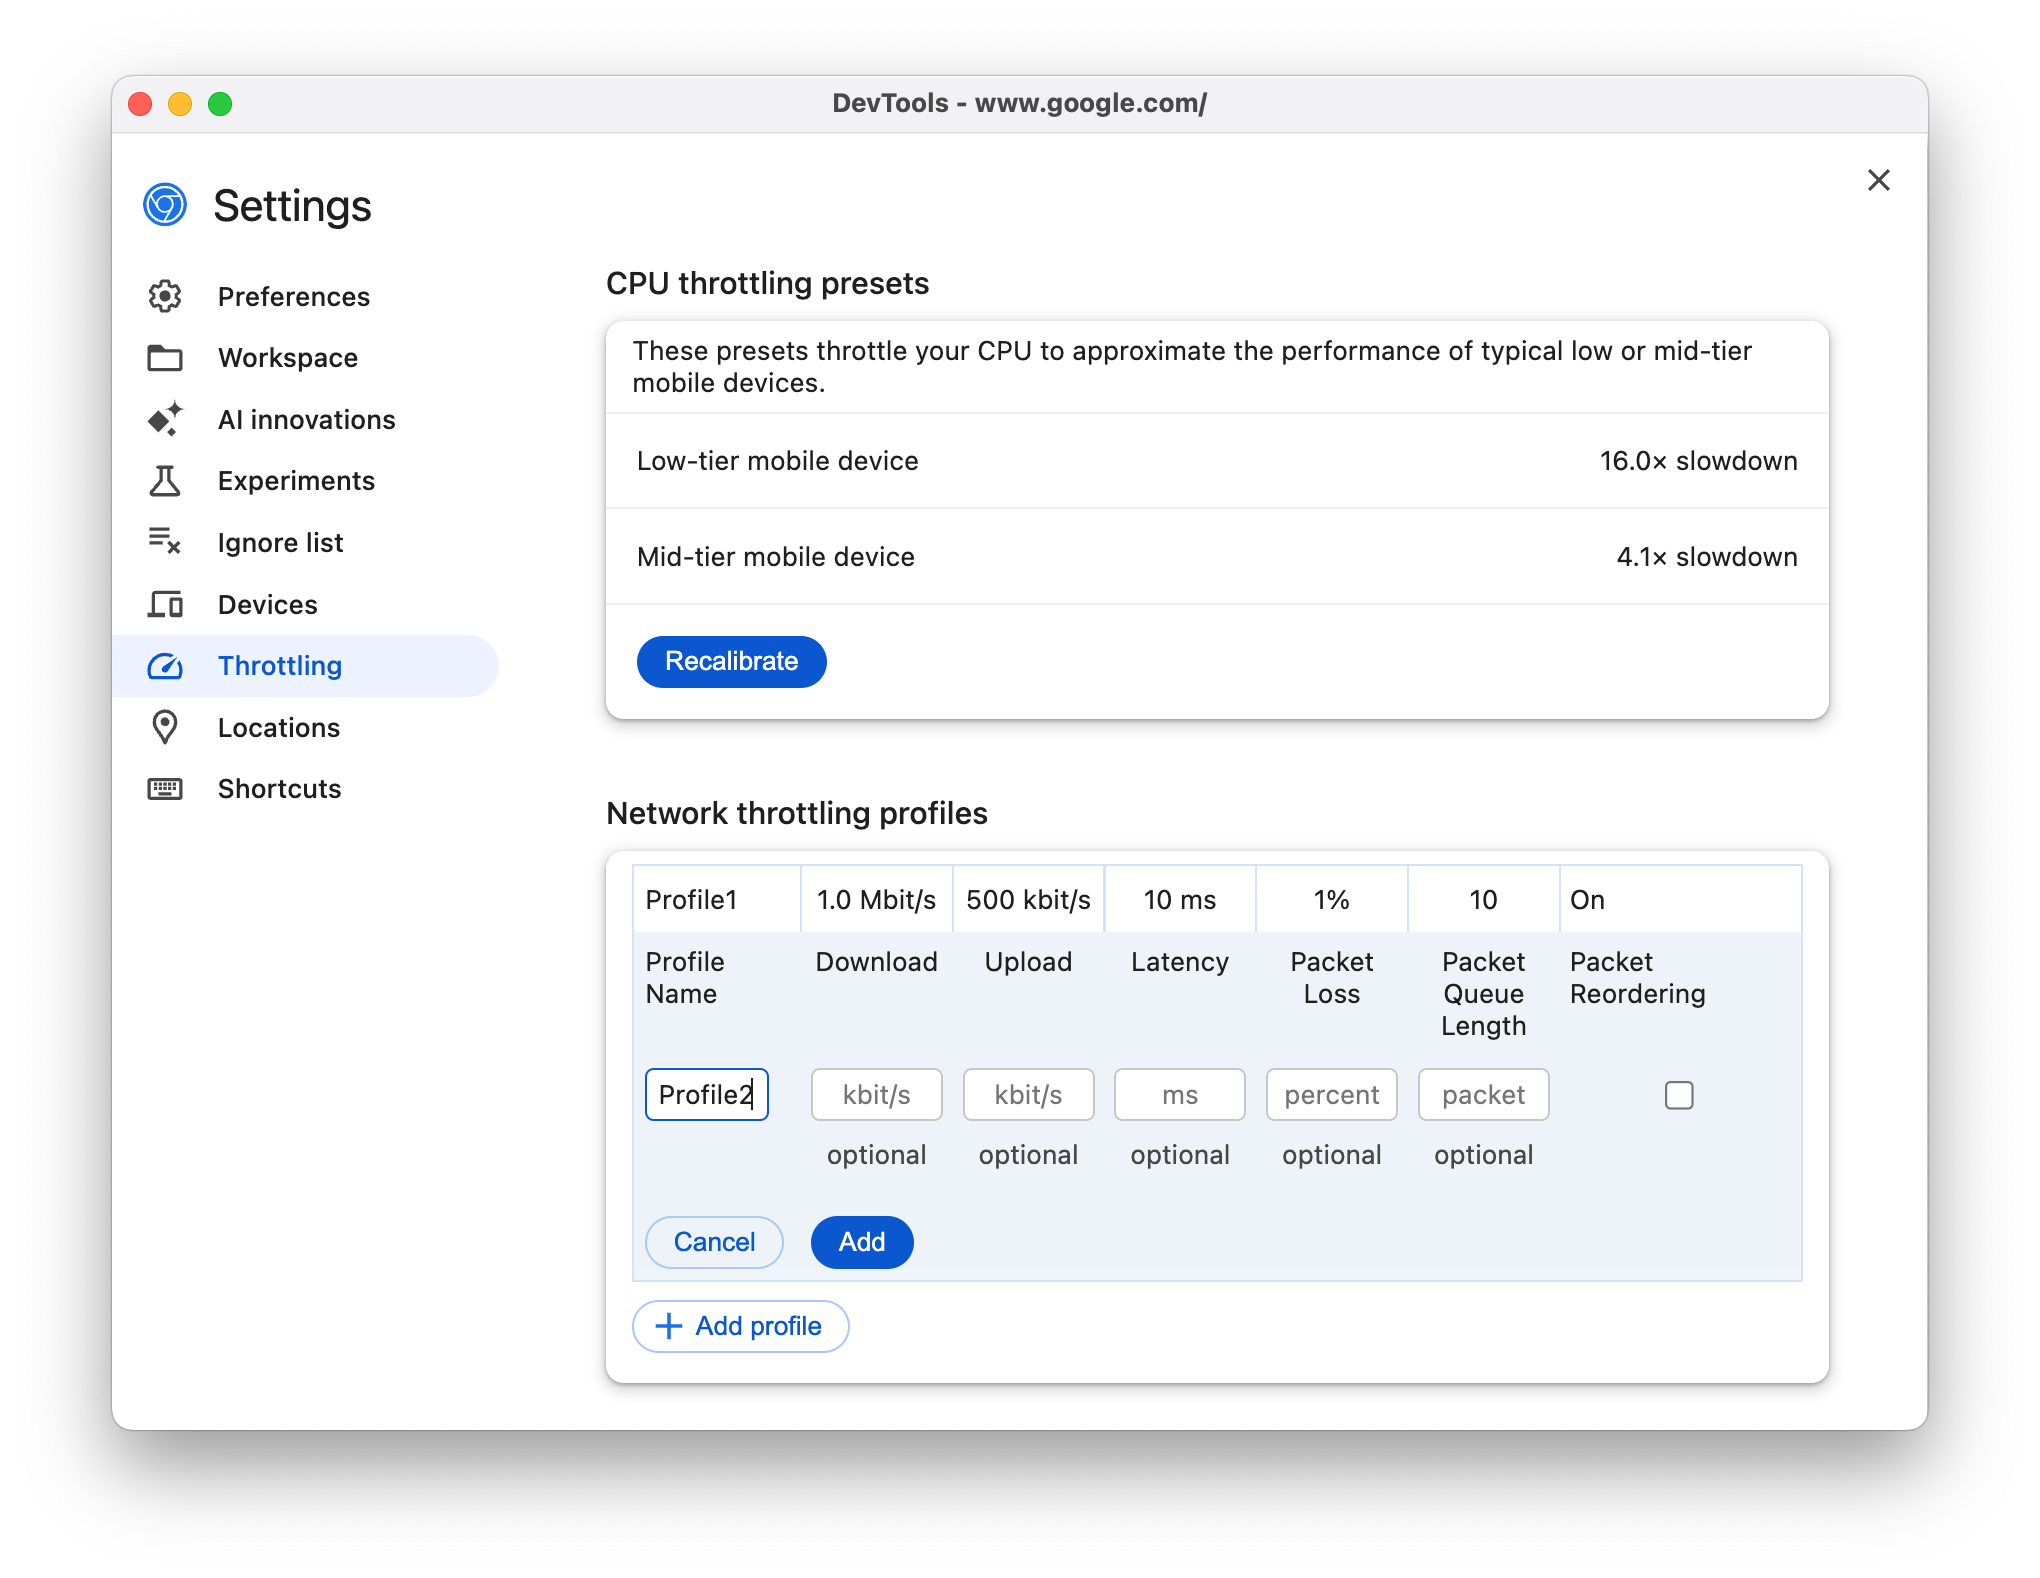
- Packet loss (%): Simulates an unreliable connection where some data packets are dropped and need to be retransmitted. This is common on mobile or poor Wi-Fi networks.
- Packet queue length & Packet reordering: These are highly advanced options for simulating specific network hardware behaviors and are rarely needed for typical web performance testing.
These advanced settings are powerful for emulating very specific, often problematic, network environments, allowing you to test the resilience of your application.
Conclusion
You've now moved beyond the one-size-fits-all presets and have a framework for creating and applying nuanced network profiles that better reflect your users' diverse connection realities.
Key Takeaways:
- Built-in presets like "Slow 4G" are just predefined combinations of Download/Upload speed and Latency.
- You can create custom throttling profiles in DevTools Settings to simulate any network condition your users might face.
- It's crucial to understand that DevTools uses request-level throttling, which adds a minimum delay to requests and divides bandwidth equally, differing from real-world network behavior. This knowledge allows for more accurate interpretation of test results.
- Advanced options like packet loss can be configured for simulating unreliable networks.
In our next lesson, we will examine how modern web protocols are designed to perform on the very networks we've learned to simulate. We will analyze the benefits of HTTP/2 and HTTP/3 multiplexing, seeing firsthand how they overcome the "head-of-line blocking" limitations of HTTP/1.1, especially under throttled conditions.