Recommended resources
The freely available resources this lesson will direct you to.
Hello! Last lesson distinguished junction, package-top, board, enclosure-surface, and external-ambient temperatures. The next step is to decide which of those temperatures a simulation must report, exactly where to report them, and what counts as passing. This turns a temperature plot into an engineering assessment of a PCB inside a sealed enclosure.
By the end of this lesson, you will have a reporting specification you can carry into a later Fluent model. You do not need to build that model yet.
Start with the decision, not the contour plot
Suppose the question is: Will this sealed assembly operate at its specified power in the hottest required environment without exceeding any thermal limit? That question fixes an operating case: component heat dissipation, external ambient temperature, enclosure orientation, mounting conditions, and assumptions about how the exterior loses heat. A result obtained at a different ambient or power is a result for a different case.
Next, translate the decision into observables. “The electronics stay cool enough” is not observable; “the estimated junction temperature of component A remains below its continuous-operating limit” is. Each acceptance check needs four elements:
- A defined operating case.
- A reported quantity with a location and a rule for obtaining it—for example, maximum temperature on accessible exterior faces, not simply “wall temperature.”
- A limit applicable to that quantity and operating case.
- A comparison rule, including any project-required allowance below the limit.
Keep a fifth item alongside these checks: how the quantity could be corroborated. A thermocouple can measure a specified package-top or board point; it cannot directly measure an inaccessible junction. Some important simulation outputs therefore have to be estimated from an appropriate package metric or compared indirectly with measurements.
The Texas Instruments note distinguishes recommended continuous-operating temperature from absolute-maximum temperature. Read its definitions before choosing a junction limit: passing an absolute-maximum rating is not automatically evidence of acceptable continuous operation.
[PDF] Semiconductor and IC Package Thermal Metrics - Texas Instruments
Read the definitions from Texas Instruments to identify which temperature rating answers a continuous-operation question.
In Section 7, “Miscellaneous Definitions” (p. 12), read from the explanation beginning “The temperature beyond which damage occurs to the device” through the definition of recommended operating temperature: key definitions. Notice also that “ambient” needs an explicit measurement-location convention; for this study, it will mean the external environment, not the sealed internal air.
For a real study, obtain limits from the applicable component specifications and product requirements. The numerical limits later in this lesson are hypothetical, not values supplied by that reading.
Specify outputs that answer the requirements
A Fluent model contains temperature values throughout its represented solids and air. A reporting specification selects the subset that answers the engineering question. For a sealed PCB assembly, a useful starting set is:
| Quantity to report | Reporting location and operation | Why it matters |
|---|---|---|
| Component junction temperature | Maximum in a resolved die, if the model contains one; otherwise a clearly labeled, package-supported estimate | Tests the component’s junction requirement |
| Package-top temperature | Defined top point or small measurement region | Supports a case requirement or junction estimate and can be probed |
| Board temperature near the component | Specified PCB probe location | Enables a like-for-like physical measurement |
| Peak PCB temperature | Maximum over the PCB region subject to a board-material limit | A nearby probe might miss the board hot spot |
| Accessible exterior temperature | Maximum over the accessible outer enclosure faces | Tests a surface-temperature requirement |
| External ambient temperature | Specified boundary condition, with a measurement convention | Defines the operating environment; it is not internal-air temperature |
These are not interchangeable. In particular, a volume-average component temperature can be useful for tracking a solution while it runs, but it cannot replace a peak temperature when the requirement applies to the hottest location. Similarly, an area-average wall temperature does not establish that the hottest accessible point passes.
A simplified model may represent a component as one heated block, with no die. Its block maximum is a legitimate block-model output, but it must not be renamed . Where a manufacturer supplies a suitable junction-to-top characterization parameter for the package and application, an estimate may instead be written as
Here uses the specified package-top measurement convention and is that component’s dissipated power. As discussed last lesson, is not a series resistance through which all device power flows. Record the parameter’s source and applicability when reporting the estimate; if no defensible junction method is available, mark the junction criterion not yet assessed rather than declaring a pass.
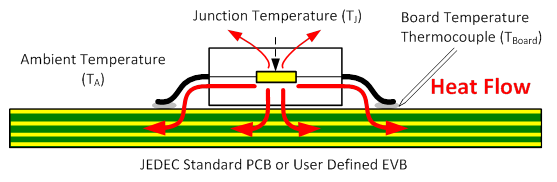
A measurement plan also disciplines the choice of reporting points. The following reading describes practical package-top and nearby-board measurements. Its suggested air-temperature locations concern its measurement arrangement; do not substitute them for the external ambient convention of a sealed-enclosure study.
How to Evaluate Junction Temperature Properly with ...
Read Texas Instruments’ measurement guidance to connect simulated point temperatures with temperatures that could later be checked on hardware.
In Section 4, “About Temperature Measurement” (p. 9), read the thermocouple guidance from package-top measurement. Then, under the PCB temperature testing discussion, read from “Regarding the PCB temperature testing point” through board-point selection. Focus on why “near the component” is less reproducible than a specified point and attachment method.
A simulated peak and a physical probe serve different purposes. You might define a board probe a specified distance from the package for comparison with a thermocouple, and separately report the model’s maximum PCB temperature for a board limit. Do not assume the probe captured the maximum.
Preview the reporting workflow in Fluent
The following sealed-enclosure tutorial shows Fluent report definitions for a heated chip, enclosure walls, and an internal-air velocity point. Watch the setup of these reports, not as a boundary-condition recipe for your eventual geometry. The tutorial uses a simplified model; your future PCB and enclosure may need different reporting surfaces.
Ansys Fluent: Introduction to Natural Convection | Tutorial
Watch “Ansys Fluent: Introduction to Natural Convection” by CFDKareem for a concrete example of turning a sealed-enclosure problem into monitored Fluent quantities.
First watch the problem: identify the sealed internal-air region and note that it has no inlet or outlet. Then watch report definitions: the presenter creates a chip volume-average temperature, an enclosure-wall area-weighted-average temperature, and a point-velocity monitor. Notice the selected zone or surface and the selected averaging operation for each report.
The video’s averages are useful diagnostic monitors: they help show whether reported values are still changing as Fluent iterates. To test peak-temperature limits in your study, add separate maximum-temperature reports over the appropriate represented die or component region, PCB region, and accessible exterior faces. Report definitions can generally be created from Fluent’s Report Definitions controls by selecting the relevant volume or surface report, temperature variable, operation, and named zone or surface; the exact menu presentation can vary by version. A point report requires a defined point surface at the intended coordinates.
Plan named regions before meshing: for example, distinguish package top, PCB, accessible outer walls, and inner walls. This matters particularly if an enclosure wall is represented by a simplified thermal boundary rather than an explicitly meshed solid: the reported temperature on that boundary may not automatically be the exterior-surface temperature required for an accessible-surface check.
Do not add an “outlet air temperature” simply because it appears in other electronics-cooling examples. A sealed internal-air domain has no outlet. An internal-air point temperature or velocity may help diagnose circulation, but it is not external ambient and does not replace a component or wall acceptance check.
Write an acceptance sheet before running the model
Consider an illustrative steady operating case: the external ambient is ; the selected component dissipates ; other modeled components dissipate in total. The enclosure orientation and exterior heat-loss assumptions are fixed and documented. Suppose the project has specified hypothetical limits of for continuous junction operation, for the hottest PCB location, and for accessible outer surfaces.
For an upper-temperature limit, retain the margin definition from last lesson:
A project may additionally require a minimum margin rather than accepting a result barely below its limit. This allowance is a study requirement, not a universal CFD correction. One concise acceptance sheet would look like this:
| Check in the specified operating case | Reported result | Hypothetical limit | Required minimum margin | Decision |
|---|---|---|---|---|
| Junction estimate from a specified package-top point and applicable package parameter | Pass provisionally: margin | |||
| Maximum over the PCB region subject to the limit | Pass: margin | |||
| Maximum over accessible outer enclosure faces | Fails the project criterion: margin |
For illustration, the junction estimate could come from a package-top result, device dissipation, and an assumed applicable . Those figures are not a recommended parameter for any particular component. The junction decision remains provisional until the parameter’s suitability and the model’s credibility are established.
The exterior result shows why the comparison rule must be written in advance: is below the illustrative limit, yet it does not meet the project’s required margin. Nor could a cooler average wall temperature overturn a failure of the specified maximum check.
Keep solution-quality checks separate from thermal acceptance checks. For this steady sealed case, record whether key temperature monitors stabilize and whether heat rejected through all external paths accounts for modeled input power, using a consistent heat-flow sign convention. If the total input is and accounted external rejection is , the difference is , or of input. That is an energy-accounting diagnostic—not another allowable temperature. A small imbalance alone does not prove that the geometry, boundary conditions, or peak temperatures are accurate; later lessons will address numerical verification in detail.
Finally, state the scope of the claim. A steady calculation at one ambient, power allocation, and orientation cannot by itself certify startup temperatures, other operating modes, or hotter environments. Its acceptance sheet applies to the stated case.
Takeaways and next step
A useful electronics-cooling result is a defined quantity paired with a matching limit: specify the operating case, physical location, reporting operation, and comparison margin. Report probe locations for possible measurements and maxima where limits concern hot spots. Keep modeled block temperatures, estimated junction temperatures, internal air, and external ambient distinctly labeled.
This completes the initial framing of the enclosure study. Next, you will examine the conduction physics that govern temperature drops through solids, beginning with Fourier’s law; those calculations will help explain—and later check—the temperature differences your simulation reports.