Recommended resources
The freely available resources this lesson will direct you to.
Hello! Let's build on what we accomplished in our last session.
In the previous lesson, you successfully directed Claude to take your SVG asset from Figma and compose it into a static scene within a browser. You now have a live index.html file showcasing your design, centered and ready for the next stage.
Today, we'll focus on the crucial skill of refinement. The learning outcome for this lesson is to inspect the browser output and make minor positional adjustments directly in the CSS. Think of this as the final polish before the performance begins. While Claude is excellent at generating the broad strokes, you, as the designer, have the final say on the pixel-perfect details. We'll learn how to use the browser's built-in tools to "nudge" elements into their final, perfect positions.
1. Opening the Inspector: Your Digital Loupe
Every modern web browser comes with a powerful suite of "Developer Tools." For our purposes, the most important part is the Inspector, which lets us see the underlying HTML structure and the CSS styles applied to every element on the page. It's like having Figma's Layers and Properties panels for any live website.
Your first step is to learn how to access and navigate this tool.
- Open the
index.htmlfile from our previous lesson using Live Server. - Once the page is open in your browser, right-click on your SVG and select Inspect.
This will open the Developer Tools panel. Let's watch a quick video to get oriented.
Chrome DevTools Tips – Styles Pane & Elements Panel
This clip from CSS Weekly quickly shows the most direct way to open the developer tools and select an element for inspection.
Watch from 00:10 to 00:38. The key takeaway is the 'Inspect' action, which immediately highlights the element in the code and shows its styles. On Mac, the shortcut is Command + Shift + C.
You'll see two main areas:
- The Elements Panel: This shows the live Document Object Model (DOM), which is the browser's representation of your HTML code. It's structured like a layer tree, which should feel familiar.
- The Styles Pane: This is where the magic happens for us. It lists all the CSS rules being applied to the currently selected element.
2. Reading the Styles Pane
Now that you have the inspector open, select the <body> element or the <div> that contains your SVG. Look at the Styles pane. You'll see the CSS that Claude generated to center your element. It probably uses display: flex or position: absolute.
It's crucial to understand what you're seeing here. The Styles pane shows you:
- Which CSS rules are active.
- Which properties have been overridden (they appear with a strikethrough).
- The file where the style is defined (in our case, it will say
<style>because our CSS is inside the HTML file).
Let's watch a short segment that explains how to interpret this information.
Debugging CSS, no extensions required - Using your devtools
Kevin Powell provides a clear, beginner-friendly tour of the Styles pane. He explains how to see which styles are active and how to spot overridden properties, which is key for debugging.
Watch from 01:54 to 04:34. Focus on how he identifies an element with the selector tool and then analyzes its properties in the Styles pane, particularly the concept of crossed-out styles.
A very visual and intuitive part of the inspector is the Box Model diagram. This shows you the margin, padding, and border of the selected element, which are fundamental to spacing and positioning.
This official Chrome documentation shows how to use the interactive Box Model diagram to both view and change an element's dimensions.
Read the short section titled 'Change the dimensions of an element'. Notice how hovering over the padding or margin in the diagram highlights it on the actual page. This visual feedback is invaluable for understanding how spacing is applied.
3. Live Editing: Nudging Your Design into Place
This is where you take control. The most powerful feature of the Styles pane is that you can edit any CSS property and see the change happen live in the browser. These changes are temporary and will be lost if you refresh the page, making it a perfect sandbox for experimentation.
Let's say your SVG is centered, but you want to move it up by 20 pixels. You could find the top or margin-top property and change its value.
The following resource is a comprehensive guide, but we'll focus on the most designer-friendly ways to change values.
The Chrome DevTools documentation provides a detailed reference for all the ways you can change CSS. We'll focus on the most direct and intuitive methods.
Read the sections under the 'Change CSS' heading titled 'Change a declaration name or value' and 'Change length values'. Pay special attention to the keyboard shortcuts (using arrow keys to increment/decrement) and the ability to drag horizontally on a value to change it. These two techniques feel very much like 'nudging' in a design tool.
Practical Exercise: Fine-Tuning Your Scene
It's time to apply these concepts. With your index.html open and the Inspector visible:
-
Select the Container: Use the element selector tool (the little arrow in a box) to click on your SVG. In the Elements panel, find the element that wraps it—this is what has the centering styles applied (it's likely a
<div>or the<body>itself). -
Experiment with Position:
- Find the
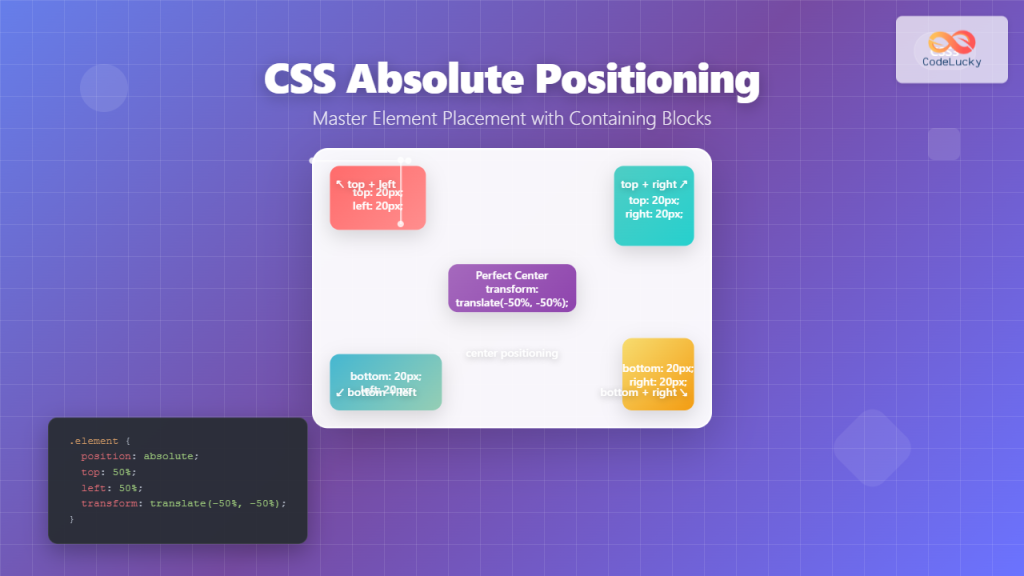
position: absoluteordisplay: flexproperties. Click the checkbox next to one of them to disable it and see what happens. Click it again to re-enable it. - If your layout uses properties like
top: 50%orleft: 50%, click on the50%value. - Use your keyboard's Up and Down arrow keys to nudge the value. See how the SVG moves on the page. Hold Shift while pressing the arrows to change the value by 10 at a time.
- Hover your mouse over a pixel value (e.g.,
margin-top: 20px). Your cursor should change. Click and drag left or right to "scrub" the value.
- Find the
-
Transfer Your Changes:
- Once you're happy with an adjustment, you need to make it permanent. You can't save in the browser. You must copy your changes back to your code in VS Code.
- The easiest way is to copy the entire changed rule. The video below demonstrates this and a more advanced "Changes" tracker.
Chrome DevTools Tips – Styles Pane & Elements Panel
Let's return to the 'Chrome DevTools Tips' video to see the best ways to get your changes out of the browser and into your code.
Watch from 00:38 to 03:49. The first part shows how to right-click to copy a single declaration or an entire rule. The second part introduces the 'Changes' drawer, which is fantastic for tracking multiple adjustments and copying them all at once.
After making your adjustments in the browser, copy the modified CSS rule and paste it over the old rule inside the <style> tag in your index.html file in VS Code. Save the file, and your changes will now be permanent.
Key Takeaways
- Inspect, Don't Guess: The browser's Inspector is your ground truth for how code is rendered.
- Live Editing is for Experimentation: The Styles pane is a sandbox. You can change, add, or disable CSS properties in real-time to test ideas without any permanent consequences.
- Designer-Friendly Controls: Use arrow-key "nudging" and value "scrubbing" for quick, tactile adjustments that feel natural to a designer's workflow.
- Copy Back Your Work: Changes made in the browser are temporary. You must copy the final CSS back into your source file in VS Code to save them.
Next Up
Your static scene is now composed and positioned with pixel-perfect precision. The stage is set. In our next lesson, we will finally bring it to life. You'll learn how to write a structured, natural-language prompt for Claude to animate a single SVG element using CSS keyframes, officially beginning your journey into code-based motion design.