Recommended resources
The freely available resources this lesson will direct you to.
Hello, and welcome to the first lesson in your CMA preparation. We’ll begin with the financial reports that underpin the rest of this module. Once you can see how they fit together, topics such as adjusting entries, financial statement preparation, and cash-flow analysis will have a clearer purpose.
By the end of this lesson, you should be able to explain what each of five statements reports and trace the key amounts between them. Plan on about 40 minutes, including the videos, reading, and worked example.
A financial position at a date, and activity over a period
Imagine looking at a company on December 31. Its balance sheet tells you what it has and how those resources are financed on that date. To understand how it arrived there, you need reports covering the year ended December 31. That distinction between a date and a period is the first organizing principle.
Watch this introduction for the balance sheet, income statement, and statement of cash flows. We will add the other two statements shortly.
FINANCIAL STATEMENTS: all the basics in 8 MINS!
“Financial Statements: All the Basics in 8 Mins!” from Accounting Stuff gives a visual introduction to three statements and the different questions they answer.
Watch position and profit for the balance sheet as a dated snapshot and the income statement as a report over a period. Then watch cash movements for why cash needs its own report and how operating, investing, and financing activities are grouped. Focus on the reporting periods and ending cash, rather than on preparing the statements.
The balance sheet obeys the accounting equation:
Assets are the company’s resources, liabilities are its obligations, and equity is the owners’ residual interest as recorded in the accounts. Equity is not necessarily what the owners could receive by selling or liquidating the company.
Here is the full set of reports we will connect:
| Statement | What it explains | Time covered |
|---|---|---|
| Balance sheet | Assets, liabilities, and equity | A specific date |
| Income statement | Revenues, expenses, gains, losses, and net income or loss | A period |
| Statement of comprehensive income | Net income plus qualifying other comprehensive income | A period |
| Statement of changes in equity | Why each component of equity changed | A period |
| Statement of cash flows | Cash received and paid, grouped by activity | A period |
The balance sheet gives an ending position. The other four explain different kinds of movement during the period.
Net income explains part—but not all—of a change in equity
The income statement measures performance under accrual accounting. In its simplest form, revenue less expenses produces net income; gains and losses included in earnings also affect that result. Net income then becomes one of the changes reported in equity.
Consider a company that provides a service for $1,000 in December but collects payment in January. The December income statement can report the earned revenue even though no cash arrived in December. The December balance sheet instead shows an asset, accounts receivable, representing the customer’s unpaid amount. When the customer pays in January, cash increases and the receivable decreases; collecting it does not create another $1,000 of revenue.
This example gives two links to remember: a transaction can affect both a period’s income statement and its ending balance sheet, while the related cash movement may occur in a different period. We will work through the entries behind that timing in the next lesson.
The diagram below highlights several links among the three statements introduced in the video. It is useful as a map, but it does not show the separate comprehensive income and changes-in-equity reports.
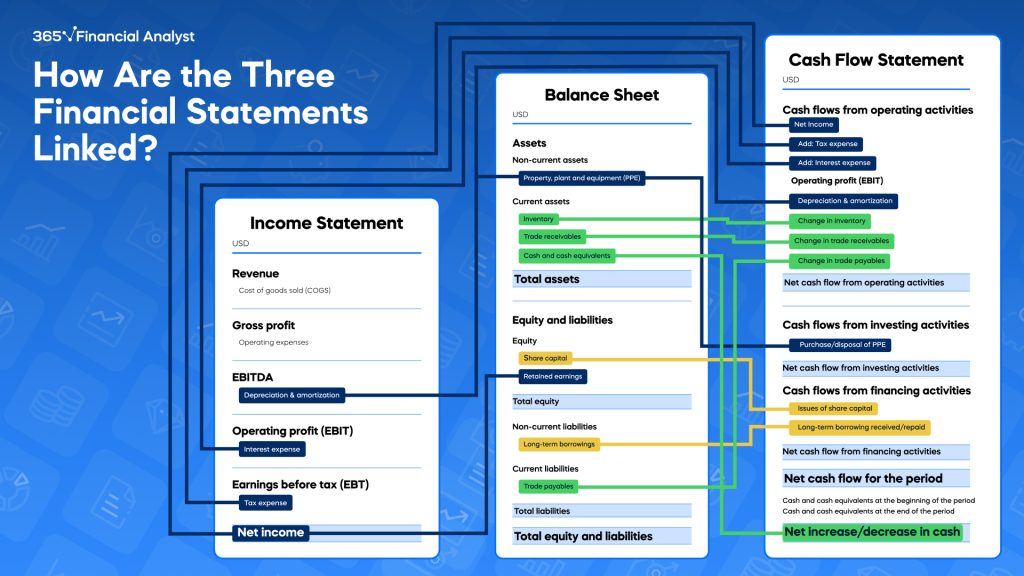
In particular, do not read a connection between net income and cash flows as meaning that they are equal. A sale on credit can increase net income before cash is received; depreciation can reduce net income without using cash in that period.
Comprehensive income and the changes in equity
Some changes in equity arise from gains or losses that the applicable accounting rules place outside net income. These are reported as other comprehensive income, or OCI. With OCI treated as a signed amount—positive for a gain and negative for a loss—the relationship is:
For a US GAAP example, a qualifying unrealized gain on an available-for-sale debt security may be reported in OCI rather than in net income. Not every unrealized gain belongs in OCI; its treatment depends on the item and the accounting rules.
Watch how a company’s equity statement makes these distinctions visible.
Statement of changes in equity
“Statement of Changes in Equity” from The Finance Storyteller uses Walmart to show why an ending equity balance alone cannot explain what happened during the year.
Watch the equity question to see the link between two balance sheets. In the major changes, distinguish net income, OCI, and dividends; the dividend amount matches cash paid in the example because declaration and payment occur in the same year. Finish with the equity columns to see why separate equity components matter.
The statement of changes in equity reconciles equity at the beginning and end of the period. For a corporation, it commonly separates share capital, retained earnings, and accumulated other comprehensive income (AOCI). In a simplified case:
New shares generally increase contributed equity. Dividends are distributions to owners, not expenses, so they reduce equity without reducing net income or comprehensive income. The ending balances from the changes-in-equity statement appear in the equity section of the ending balance sheet.
The following reading puts all five reports alongside one another. It uses an IFRS company, whereas your CMA preparation is US-focused; use it for the relationships, not as a list of US GAAP-specific OCI rules.
3.3 Financial Statements and Their Interrelationships – Intermediate Financial Accounting 1
Section 3.3 of Intermediate Financial Accounting 1 traces net income and OCI into equity, then connects ending equity and cash to the balance sheet.
In Section 3.3, “Financial Statements and Their Interrelationships,” move past the two illustrated Wellbourn statements to the paragraph beginning “As can be seen from the flow of the numbers above.” Read the explanation through the final paragraph before subsection 3.3.1. Focus on which amount enters retained earnings, which enters AOCI, and where ending equity and cash appear. Skim the IFRS-specific examples of OCI; US GAAP does not necessarily treat those items the same way.
A helpful precision: net income enters retained earnings; OCI enters AOCI in this simplified presentation. Both contribute to total equity, but they remain distinguishable.
Cash explains a different change in the balance sheet
The statement of cash flows reconciles beginning cash to ending cash. It groups cash movements by their source or use:
- Operating activities relate principally to the company’s revenue-producing activities.
- Investing activities include cash paid for, or received from selling, long-lived assets and certain investments.
- Financing activities include cash from borrowing or issuing shares, and cash used to repay borrowing or pay owners.
Together, those sections explain the period’s net change in cash:
The operating section can begin with net income and reconcile it to operating cash flow. For example, an increase in receivables indicates that some recognized revenue has not yet been collected; depreciation reduced net income but was not a current-period cash payment. This is the idea behind the indirect method, which you will prepare in detail later in this module.
Timing matters when comparing reports. Dividends declared reduce equity, whereas dividends paid use cash. If declaration and payment fall in different periods, the amounts on the equity and cash-flow statements for one period need not match.
One company, five connected reports
Let’s bring the relationships together for a small corporation, Harbor Services. Ignore income taxes for this illustration.
At the start of the year, Harbor has $40 cash, $60 of equipment (net), and a $10 available-for-sale debt investment. It owes $30 and has $80 of share capital. Its opening balance sheet balances: assets of $110 equal liabilities of $30 plus equity of $80.
During the year, Harbor earns $50 of service revenue, all initially billed to customers, and collects $35 of it. It incurs and pays $20 of operating expenses, and records $5 of equipment depreciation. Its debt investment has a qualifying $4 unrealized gain reported in OCI. Harbor also issues $12 of shares for cash, borrows $10 cash, buys $8 of equipment for cash, and declares and pays $6 of dividends.
First, performance: the income statement reports $50 revenue and $25 total expenses, including depreciation. Net income is $25. The statement of comprehensive income adds $4 OCI, giving total comprehensive income of $29. Neither the share issue nor the borrowing is income; the dividend is not an expense.
Next, equity: Harbor’s $80 opening equity increases by $25 net income, $4 OCI, and $12 from issuing shares, then decreases by $6 of dividends. Ending equity is $115. Its components are $92 share capital, $19 retained earnings, and $4 AOCI.
Then, cash: customers paid $35 and operating expenses used $20, so operating activities provided $15 cash. The equipment purchase used $8 in investing activities. The share issue and borrowing supplied $22, while the dividend payment used $6, so financing activities provided $16. The three sections explain a $23 net increase in cash, from $40 to $63.
Notice the three different results: $25 net income, $15 operating cash flow, and $23 total cash increase. The $15 operating cash flow is $10 below net income because $15 of earned revenue remains in receivables, partly offset by the $5 noncash depreciation expense.
Finally, check the ending balance sheet. It reports $63 cash, $15 receivables, $63 equipment (net), and the $14 investment: $155 total assets. Liabilities are $40 after the new borrowing, and ending equity is $115. The accounting equation holds, and the cash and equity balances agree with their respective reconciliation statements.
Key takeaways
The five statements answer related but distinct questions. The income statement’s net income contributes to retained earnings; OCI contributes to AOCI; and the statement of changes in equity explains the equity shown on the ending balance sheet. The statement of cash flows explains the change between the beginning and ending balance-sheet cash amounts. Throughout, keep a period’s activity distinct from a balance on a date—and never assume profit, comprehensive income, and cash flow are interchangeable.
Next, we’ll look more closely at accrual accounting and adjusting entries, the mechanics that put revenues and expenses in the appropriate periods.