Recommended resources
The freely available resources this lesson will direct you to.
Hello!
In our last few lessons, we've designed the core architecture of a multi-agent system. We've defined specialized agents, created an orchestrator to manage the workflow, and engineered the handoffs between them to ensure context is preserved. We have a complete blueprint. Now, we need to turn on the lights.
This lesson addresses a fundamental aspect of any production system: observability. Our learning outcome is to trace an end-to-end request through a multi-agent system to identify bottlenecks and failure points. You can't debug, optimize, scale, or sell what you can't see. Tracing transforms your agentic system from a "black box" that produces an output into a transparent, analyzable process. This is the bridge between a promising prototype and a reliable, client-ready service.
We'll begin by exploring why observing agentic systems presents unique challenges compared to traditional software. Then, we will establish a structured framework for tracing and use it to diagnose both performance issues and logical failures.
1. The New Frontier of Observability: From Code Paths to Reasoning Paths
Given your background in computer science, you're undoubtedly familiar with the pillars of observability in distributed systems: logs, metrics, and traces. These tools are designed to make sense of complex but largely deterministic code paths.
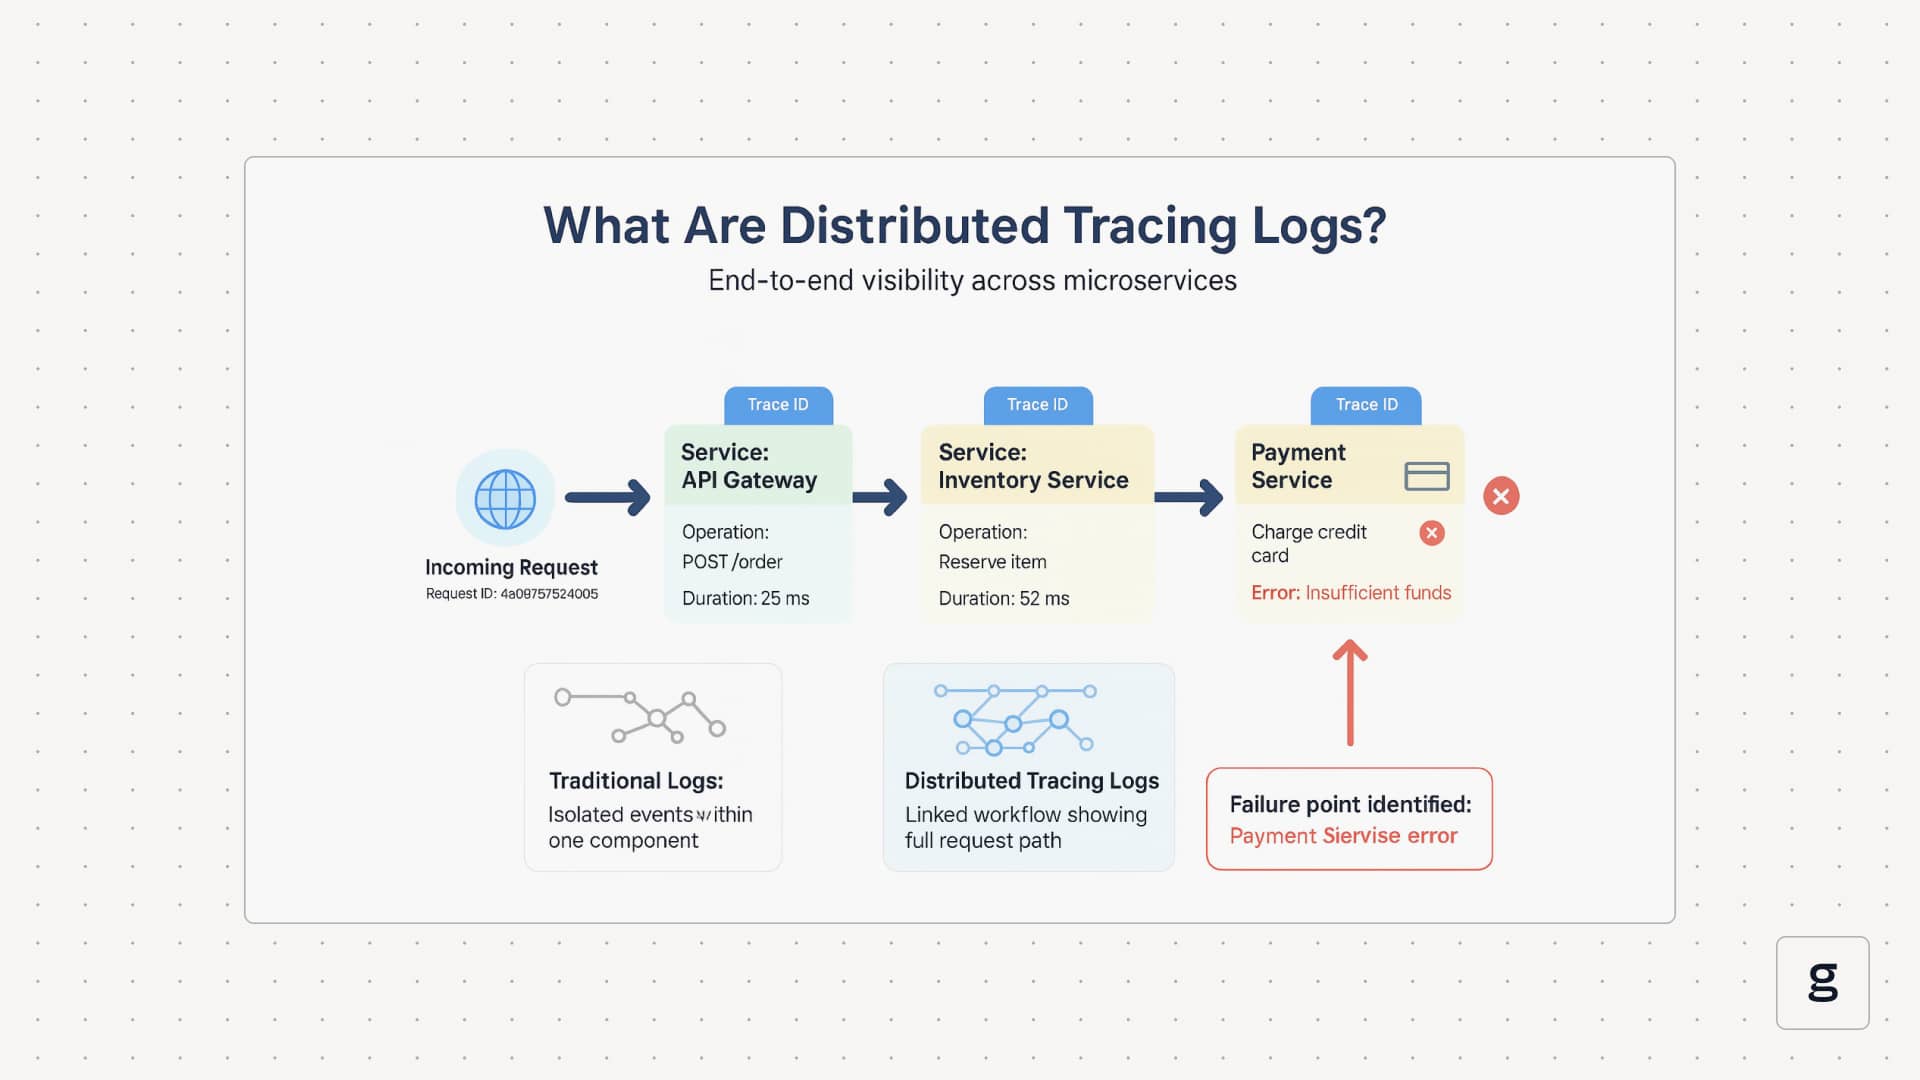
However, agentic systems introduce a new variable: probabilistic reasoning. An LLM's "code path" is not fixed; it is generated on the fly. Therefore, we are not just debugging pre-written logic; we are debugging an emergent reasoning process.
How an AI Agent Debugged a Production Incident in 80 Seconds (For 60 Cents)
This video, 'How an AI Agent Debugged a Production Incident', effectively frames why AI is fundamentally changing observability. It highlights how agents can process telemetry data at a scale humans cannot.
Please watch from 03:48 to 05:18. Focus on the core argument: traditional observability tools were built to compress vast data for human comprehension, while LLMs can consume and interpret this raw data directly. This shift requires a new approach to how we capture and present system data.
This means our tracing methodology must capture not just the inputs and outputs of services, but the intermediate thoughts, decisions, and tool interactions that constitute the agent's reasoning path.
2. The Anatomy of a Multi-Agent Trace
To effectively trace a request, we need a clear, hierarchical structure to organize the data. Different frameworks use slightly different terms, but the core concepts are consistent. We'll explore two complementary views on this structure.
Conceptual Primitives: Runs, Traces, and Threads
First, let's define the building blocks of an observable agent interaction.
Building Better AI Agents: Observability and Evaluation
The team at LangChain, who build tools for agent observability, break down agent activity into three levels of complexity. This provides a useful mental model.
Watch the segment from 07:12 to 08:49. Pay close attention to the definitions of a run (a single LLM or tool call), a trace (a full agent execution without human intervention), and a thread (a sequence of traces with human input).
This hierarchy lets us analyze the system at different granularities:
- Run: The most atomic unit. Useful for debugging a single tool call or prompt-response pair.
- Trace: The complete journey of a single user request through the multi-agent system. This is our primary focus for today's learning outcome.
- Thread/Conversation: The full interaction with a user over time. Useful for analyzing user behavior and session-level context.
An Implementation Schema: The ID Hierarchy
To put this into practice, we need a concrete schema for identifying and linking these events. A robust approach uses a three-level ID hierarchy.
Multi-agent AI analytics: Event schema for observability
This article from RudderStack proposes a detailed analytics specification for multi-agent systems. Its ID hierarchy is a practical blueprint for implementing tracing.
Please read the section 'Understanding the ID hierarchy for multi-agent tracking'. It introduces conversation_id, interaction_id, and agent_session_id. Study the real-world example provided to see how these IDs link together to represent a complex workflow.
Let's formalize this powerful structure:
conversation_id: A top-level identifier that groups an entire conversation with a user, potentially spanning multiple questions and answers.interaction_id: Identifies a single end-to-end user request and the system's final response. This corresponds to the "trace" we discussed earlier.agent_session_id: Identifies the execution of a single, specialized agent within an interaction. A singleinteraction_idwill typically contain multipleagent_session_ids as the request is handed off between agents.
This hierarchy is what allows you to reconstruct the entire journey of a request and attribute performance, cost, and errors to specific components.
3. What to Trace: An Event-Based Specification
With our ID structure in place, we can define the specific events to log. A comprehensive approach separates user-facing events from internal agent performance events. For our goal of identifying bottlenecks and failures, the internal events are key.
The RudderStack article outlines three critical events for tracking the internal workings of your system:
ai_agent_session_startedai_agent_session_completedai_agent_step_completed
Multi-agent AI analytics: Event schema for observability
Let's return to the RudderStack article for the detailed specification of these events. This section provides the concrete fields you need to log to gain deep visibility.
Read the section 'Agent Performance & Optimization Events', focusing on the purpose and key properties of the three event types. Note how ai_agent_step_completed gives you granular visibility into LLM calls vs. tool calls. This distinction is crucial for bottleneck analysis.
By logging these events with properties like agent_name, status, duration_ms, model_used, tools_used, cost, and tokens_used, you are gathering the raw data needed to diagnose nearly any issue. For instance, duration_ms at the step level immediately tells you if latency comes from a slow API call (a tool_call step) or a complex LLM generation (an llm_call step).
4. Analysis: From Traces to Insights
Once you are collecting structured traces, you can begin to diagnose problems. We'll focus on two categories: performance bottlenecks and logical failures.
Identifying Performance Bottlenecks
This is the most direct application of tracing. By analyzing the logged duration_ms and cost properties at each level of the hierarchy, you can answer critical questions:
- Latency: Which agent session is the slowest? Within that session, is it an LLM call or a tool call that's taking the most time?
- Cost: Which agent is responsible for the majority of the token consumption? Is it using an expensive model (like GPT-4 Turbo) for a task that a cheaper model (like Claude 3 Haiku) could handle?
The RudderStack article (LINK, sections 2 and 10) highlights that this analysis can lead to 30-50% cost reductions and 40-60% latency improvements simply by right-sizing models and optimizing orchestration.
Identifying Logical Failure Points
More complex, and more unique to agentic systems, is identifying logical failures in the reasoning process. Your traces are the evidence. To systematically categorize these failures, we can use a formal taxonomy.
[PDF] Why Do Multi-Agent LLM Systems Fail? - arXiv.org
The recent paper '[PDF] Why Do Multi-Agent LLM Systems Fail?' introduces MAST, the first comprehensive taxonomy of failure modes in multi-agent systems. This provides a rigorous, academic framework for classifying the errors you'll find in your traces.
First, look at Figure 1 to see the full taxonomy. Then, read Section 4, 'The Multi-Agent System Failure Taxonomy', which explains the three main categories: System Design Issues, Inter-Agent Misalignment, and Task Verification. Finally, read Appendix A for the precise definitions of each of the 14 failure modes.
Using the MAST taxonomy, you can move from "it didn't work" to a precise diagnosis. Let's see how a few of these failures would appear in a trace:
- FM-1.3: Step Repetition: Your trace shows multiple
ai_agent_session_startedevents for the same agent with nearly identical inputs, indicating a loop. - FM-2.4: Information Withholding: The
response_textfrom one agent'sai_agent_session_completedevent is missing a critical piece of data that the next agent needed (visible in itsprompt_text). This points to a flaw in the handoff design we discussed in the last lesson. - FM-3.3: Incorrect Verification: A
ReviewerAgent's session completes withstatus: 'success', but the finalai_interaction_completedevent is flagged as a failure by the user. This shows your verifier is not robust enough. - FM-2.6: Reasoning-Action Mismatch: An agent's logs might show a "thought" process that correctly identifies a plan, but the subsequent
tool_callstep shows it executing a different, incorrect action.
To see what these failures look like in practice, you can skim the concrete examples provided in the MAST paper.
[PDF] Why Do Multi-Agent LLM Systems Fail? - arXiv.org
The appendix of the MAST paper contains annotated examples of real failures from various agent systems.
Quickly scan Appendix N, 'Examples of Different Failure Modes'. You don't need to read every detail, but look at a few examples (e.g., N.1 for Step Repetition, N.4 for a Handoff Failure, N.10 for Reasoning-Action Mismatch) to get a feel for how these abstract failure modes manifest in actual agent conversations.
5. Bringing It Together: A Trace Walkthrough
Let's walk through a hypothetical investigation using the tools we've discussed.
Scenario: A user complains that asking for "a summary of recent earnings reports for tech companies" is slow and often produces an incomplete summary.
Your Investigation:
- Isolate the Interaction: You find the user's session and pull up the specific trace for that request using its
interaction_id. - Trace the Flow: You see the following
agent_sessions were executed in sequence:OrchestratorAgentSearchQueryGeneratorAgentWebSearchAgent(executed three times in parallel)SummarizerAgentFormatterAgent
- Identify Bottlenecks: You aggregate the
duration_msfrom allai_agent_session_completedevents. You discover theWebSearchAgentsessions are taking, on average, 8 seconds each, accounting for most of the latency.- Drill Down: You look at the
ai_agent_step_completedevents within one of theWebSearchAgentsessions. You find that thellm_callto decide on a search query is fast (200ms), but thetool_callto the search API is the source of the delay. This is a latency bottleneck caused by an external dependency.
- Drill Down: You look at the
- Identify the Failure Point: You examine the
response_textfrom the three parallelWebSearchAgentsessions. You notice that one of them returned an API error, but this was not handled. TheSummarizerAgentreceived input from only two of the three searches.- Classify the Failure: The
WebSearchAgentfailed to handle a tool error, and the orchestrator failed to verify that all parallel steps succeeded before proceeding. This could be classified under FM-3.2: No or Incomplete Verification. The incomplete final output is a direct result.
- Classify the Failure: The
- Formulate a Fix:
- For the Bottleneck: Implement caching for the search API tool to avoid repeated calls for common queries.
- For the Failure: Add error handling and a retry mechanism to the
WebSearchAgent's tool use logic. Modify the orchestrator to include a "quality gate" that ensures all required data sources are successfully retrieved before calling theSummarizerAgent.
This entire investigation, moving from a vague user complaint to specific, actionable fixes, is made possible by a well-designed tracing system.
Conclusion
In this lesson, we established the critical importance of observability for building reliable multi-agent systems. By moving beyond traditional logging and implementing a structured tracing methodology, you gain the ability to dissect and understand the complex, probabilistic behavior of your agents.
Key Takeaways:
- Agent observability is different: We must trace emergent reasoning paths, not just deterministic code paths.
- A structured hierarchy is essential: Using a three-level ID system (
conversation,interaction,agent_session) allows you to reconstruct and analyze any request. - Granular events are key: Logging agent sessions and individual steps (
llm_call,tool_call) with detailed properties (duration_ms,cost,status) provides the raw data for diagnosis. - Traces reveal two types of problems: You can pinpoint performance bottlenecks (latency, cost) and classify logical failures using a formal taxonomy like MAST.
You now possess the framework to instrument your agentic systems, trace their execution, and identify root causes for issues. This is an indispensable skill for anyone aiming to deliver production-grade AI services.
In our next module, "Evaluation and Evidence-Based Improvement," we will build directly on this foundation. The traces you've learned to collect are the raw material for creating evaluation datasets, benchmarking performance, and driving a systematic, evidence-based improvement cycle.