Recommended resources
The freely available resources this lesson will direct you to.
- ML Basics: False Positives, False Negativeswww.youtube.com
- Evaluation Metrics For Classification - Full Overviewwww.youtube.com
- Classification: Accuracy, recall, precision, and related metrics | Machine Learning | Google for Developersdevelopers.google.com
- 3.3. Tuning the decision threshold for class predictionscikit-learn.org
Hello. Last lesson, you used training and validation results to judge whether a model was learning useful patterns or overfitting. But “good validation performance” depends on what you measure. A model can make fewer mistakes overall while making more of the mistakes that matter most.
This lesson is about choosing an evaluation metric for a binary classification decision. You’ll identify false positives and false negatives, interpret accuracy, precision, recall, and false positive rate, then use the consequences of each error to decide what to prioritize. Allow about 35–40 minutes.
Start with the decision, not the score
Imagine a model that flags transactions for a fraud review. Define positive as “flag for review” and negative as “do not flag.” A false positive is a legitimate transaction flagged unnecessarily; a false negative is a fraudulent transaction that passes without a flag. Those errors affect different people and processes, so counting them as interchangeable can conceal a poor decision.
Watch the accuracy and binary-classification portion of NeuralNine’s Evaluation Metrics For Classification – Full Overview. Focus on how the meaning of “positive” is set by the task, rather than by whether a prediction is correct.
Evaluation Metrics For Classification - Full Overview
In Evaluation Metrics For Classification – Full Overview, NeuralNine introduces the four outcomes behind classification metrics.
Watch accuracy and outcomes. The cat-versus-dog example defines a positive class, then distinguishes true positives, true negatives, false positives, and false negatives. Apply each definition to a transaction flagged for fraud review.
The fraud-review diagram makes the distinction concrete. Its rows are predictions and its columns are what was actually true; check the labels before reading any confusion matrix, because other diagrams may arrange their axes differently.
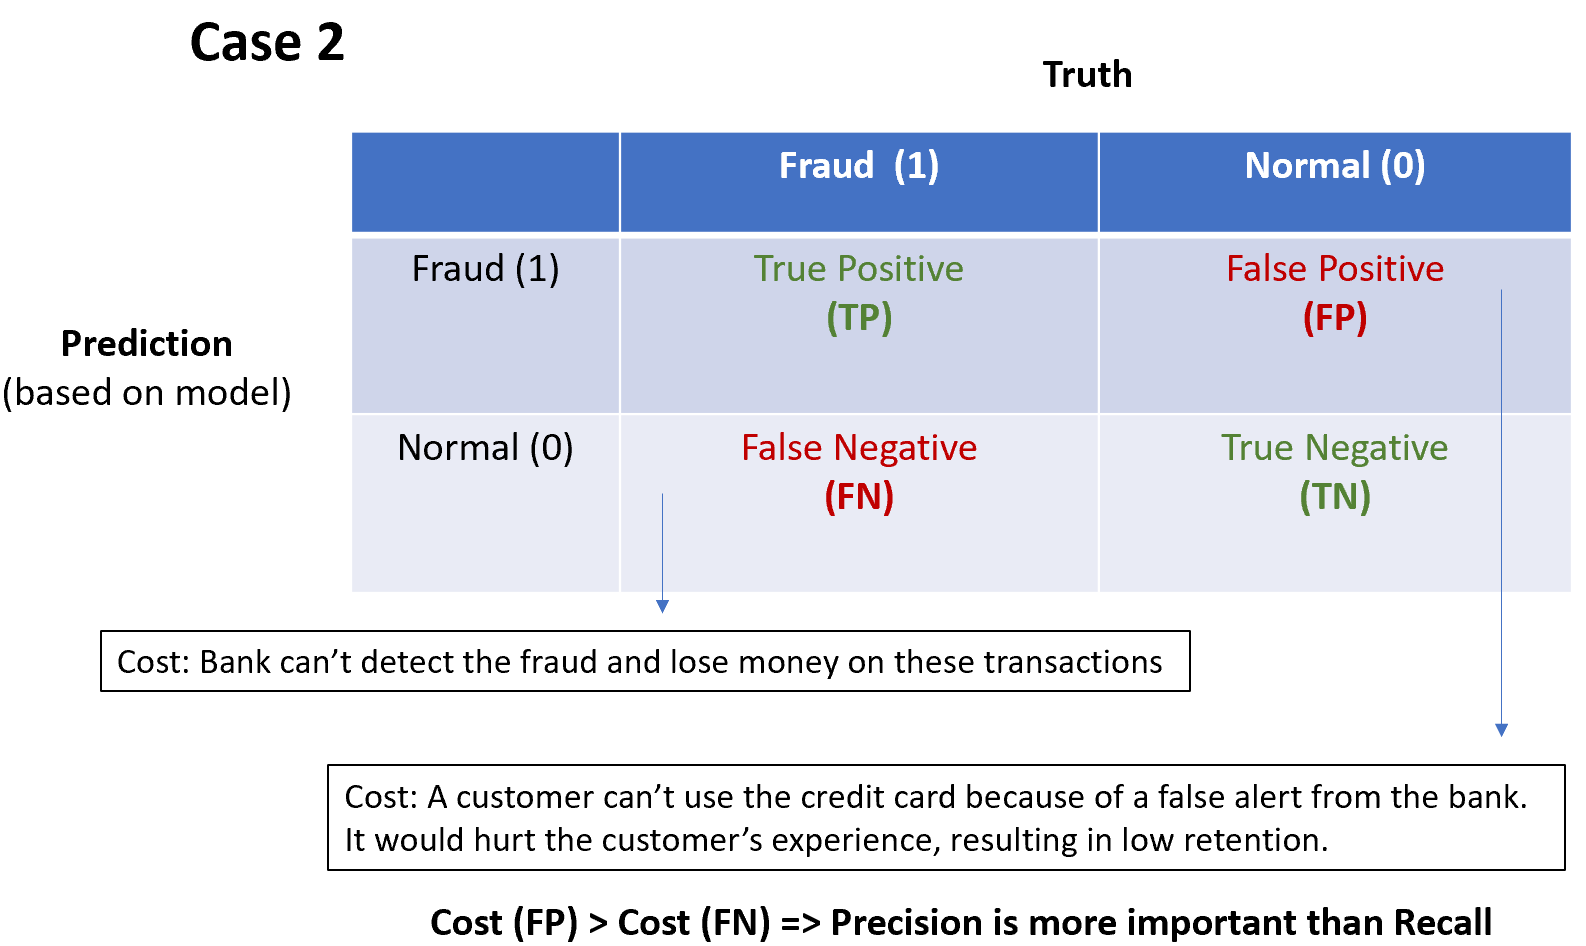
In this example, a missed fraud may mean financial loss. An unnecessary flag may interrupt a legitimate customer. The image concludes that when a false positive is more costly, precision deserves attention. That is a useful prompt, but the cost per error alone does not settle the metric choice: you also need to know how many of each error the system makes.
Ask what each metric counts
Accuracy asks, “What fraction of all predictions were correct?” For a binary classifier,
It can be useful when the classes are fairly balanced and the errors have similar consequences. It can also be misleading. If only 1% of transactions are fraudulent, a model that calls every transaction normal achieves 99% accuracy while detecting no fraud.
Two metrics look more closely at positive predictions, but they answer different questions:
Recall starts with all the transactions that truly were fraudulent and asks what fraction the model caught. Missing an actual positive lowers recall. Precision starts with all the transactions the model flagged and asks what fraction truly were fraudulent. Flagging a legitimate transaction lowers precision. Keeping those two starting groups in mind is more reliable than memorizing the formulas alone.
Watch NeuralNine’s visual explanation of the contrast. The example in which a model selects just one genuine positive shows why excellent precision can coexist with poor recall.
Evaluation Metrics For Classification - Full Overview
Continue Evaluation Metrics For Classification – Full Overview for an intuitive comparison of precision and recall.
Watch precision for the question answered by a positive prediction. Then watch recall and trade-off for the positive cases a model detects or misses. The ranges overlap briefly at the transition; you need only watch that transition once.
If false alarms themselves are the concern, another measure is often more direct:
The false positive rate asks, “Of all genuinely normal transactions, what fraction did we flag?” Precision instead asks, “Of everything we flagged, what fraction was actually fraud?” Both reflect false positives, but from different starting groups. For a review team, precision describes how many alerts are productive; for a requirement limiting disruption to legitimate transactions, false positive rate describes how often those transactions are affected.
Read Google for Developers’ Classification: Accuracy, recall, precision, and related metrics to consolidate these distinctions. The “Choice of metric and tradeoffs” table is a guide to the questions each metric answers, not a substitute for estimating the actual costs in your application.
Google for Developers explains why overall accuracy may hide costly errors and defines the rates needed to examine them.
Read the subsections “Accuracy,” “Recall, or true positive rate,” “False positive rate,” and “Precision,” followed by the table in “Choice of metric and tradeoffs.” In “Accuracy,” begin with the accuracy discussion; notice the always-negative example at its end. In the recall, false positive rate, and precision subsections, read their definitions and formulas, using missed positives, false alarms, and positive predictions to locate the surrounding passages. Finally, read the choice guide through its table. You can stop before the optional F1 discussion.
Compare policies using the errors they make
Suppose two fraud-review policies are evaluated on the same 1,000 held-out transactions. Fifty transactions were fraudulent and 950 were normal. Each policy produces these results:
| Policy | Fraud flagged | Fraud missed | Normal flagged | Normal left alone |
|---|---|---|---|---|
| A: flags more readily | 40 | 10 | 95 | 855 |
| B: flags more cautiously | 25 | 25 | 10 | 940 |
Policy A catches of the fraud: its recall is 80%. Policy B catches : its recall is 50%. But A’s precision is , about 30%, because most of its 135 alerts concern normal transactions. B’s precision is , about 71%.
Look only at accuracy, and B also appears better: it gets correct, versus A’s . None of these figures by itself tells you which policy to deploy.
Suppose, as a simplified estimate, each missed fraud costs 100 units and each unnecessary flag costs 10 units. Count the errors, then apply those costs:
A has lower estimated cost despite lower accuracy and precision. In this setting, missing fraud is expensive enough that prioritizing recall, while monitoring false alarms, makes sense.
Now imagine an otherwise comparable setting where an unnecessary flag costs 100 units and a missed fraud costs 10. A’s estimated cost becomes , while B’s becomes . B is preferable under those assumptions. Precision highlights its more trustworthy alerts; its false positive rate, rather than A’s , directly shows how much less often it disrupts normal transactions.
These costs are deliberately simplified. Real losses may vary by transaction, and review time or customer harm may be hard to express in money. The key is to make the assumptions explicit rather than let a familiar metric quietly make the decision for you.
Choose a primary measure and a guardrail
A practical choice begins by stating the positive class and the action associated with a positive prediction. Then ask which error is more consequential and how you will recognize an unacceptable number of the other error.
- If missed positives are especially costly, prioritize recall, with a limit on false alarms or review workload. Fraud detection and some screening tasks may fit this pattern.
- If positive predictions must be dependable, prioritize precision. This is useful when each alert triggers a costly investigation or consequential action. Also inspect the false positive rate if the requirement concerns the fraction of normal cases disrupted.
- If both errors have credible, comparable cost estimates, compare the total estimated cost of the policies on the same representative validation examples. Report recall and false positive rate alongside it so the result remains interpretable.
- If classes and error costs are reasonably balanced, accuracy can provide a rough summary—but inspect the error counts before relying on it.
A high precision score does not prove that the false positive rate is acceptable. Precision also depends on how common positives are: when genuine fraud is rarer, even a small fraction of normal transactions flagged can make up much of the alert queue. Nor is maximizing recall alone safe; flagging everything catches every fraud while interrupting every normal transaction. A useful metric choice therefore often has a primary objective plus a guardrail.
One final distinction helps explain why a model can support different policies. A model may estimate a score for fraud, while a separate decision rule determines which scores trigger a flag. Read only the introduction to scikit-learn’s Tuning the decision threshold for class prediction for that distinction; the mechanics of choosing a threshold come later in the course.
3.3. Tuning the decision threshold for class prediction
The scikit-learn user guide separates predicting a score from deciding what action to take, then relates that choice to the cost of missed cases.
In the introduction to “3.3. Tuning the decision threshold for class prediction,” read prediction versus decision near the beginning. Skip the API example, then read the screening example immediately before “3.3.1. Post-tuning the decision threshold.” Focus on why the error costs change the desired action, not on threshold-tuning tools yet.
For now, compare policies at their stated decision rules on the validation set, keeping the outcome definition and evaluated examples fixed. As in the previous lesson, leave the test set for a final check after you have chosen your approach.
Key takeaways
Accuracy counts all correct classifications, but it can obscure rare or costly mistakes. Recall measures the share of actual positives caught; precision measures the share of positive predictions that were right; false positive rate measures the share of actual negatives falsely flagged. Choose among them by defining the action, estimating the consequences of each error, and checking that improvement on your primary measure does not make another failure unacceptable.
Next, you’ll build a simple baseline. With a decision-relevant metric in hand, you can ask whether a learned model actually improves on a straightforward alternative.