Recommended resources
The freely available resources this lesson will direct you to.
Hello! In our previous lesson, we explored TabNet, a sophisticated architecture that performs instance-wise feature selection by learning which features to attend to for each specific prediction. This provided a powerful blend of high performance and built-in interpretability.
Today, we'll continue our exploration of adapting architectures from other domains to tabular data, directly addressing your interest in complex, "out-of-the-box" methods. We will investigate how to apply 1D Convolutional Neural Networks (CNNs) to tabular datasets. While your experience with R-CNN and YOLO has likely given you a solid understanding of 2D CNNs for image analysis, applying them to data without an inherent spatial structure, like a typical table, requires a clever approach. This lesson will show you how to create a "pseudo-spatial" structure in tabular data, enabling 1D CNNs to automatically learn complex feature interactions and hierarchies.
The Power and Problem of Convolutions on Tabular Data
You're familiar with how 2D CNNs work in computer vision: a small kernel (e.g., 3x3) slides across an image, detecting local patterns like edges, corners, and textures. The power of this approach lies in two properties: local connectivity (a neuron is connected only to a small patch of the input) and spatial locality (nearby pixels are highly correlated).
A 1D convolution operates on the same principle but in a single dimension. A 1D kernel slides along a sequence, making it a natural fit for time-series analysis, audio signals, or text (a sequence of word embeddings).

The fundamental challenge arises when we consider a standard tabular dataset. Unlike a time series or an image, the order of columns is typically arbitrary. The feature in column 2 is not necessarily more "related" to the feature in column 3 than it is to the feature in column 50. Applying a 1D convolution directly would assume a spatial relationship that doesn't exist, leading to meaningless feature extraction.
The Medium article "Convolutional Neural Networks on Tabular Datasets (Part 1)" frames this problem perfectly.
Convolutional Neural Networks on Tabular Datasets (Part 1)
Let's begin by reading the introduction and motivation from this article by Martín Villanueva.
Read from the beginning down to the end of the "Convolutional Networks" section. Pay close attention to the paragraph that begins with this sentence, as it succinctly states the core challenge we need to overcome.
The Solution: "Soft-Ordering" Features
So, if tabular features lack the necessary spatial correlation, can we create it? This is the central idea behind a technique that has proven surprisingly effective in Kaggle competitions. Instead of imposing a fixed, arbitrary order, we let the network learn a meaningful arrangement. This is the concept of a Soft-Ordering 1D CNN.
The architecture involves two key steps before the convolutions even begin:
-
High-Dimensional Projection: The initial vector of features is passed through a standard fully-connected (FC) layer that expands its dimensionality significantly. For example, a dataset with 200 features might be projected into a vector of size 4096.
-
Reshaping: This large, 1D vector is then reshaped into a 2D tensor of shape
(channels, sequence_length). For instance, the 4096-element vector could be reshaped into a tensor with 256 channels, where each channel contains a "signal" of length 16.
This process is ingenious. The FC layer doesn't just add dimensions; it learns complex, non-linear combinations of the original features. The weights of this layer effectively learn to group and order related features together into these new, short "signals". When the 1D convolution kernel slides across one of these 16-element signals, it is now operating on a sequence that has a meaningful, learned structure.
The following resource explains this concept and shows the architecture.
Convolutional Neural Networks on Tabular Datasets (Part 1)
Let's continue with the same article to see how this soft-ordering is implemented.
Read the section titled "Soft-Ordering 1-dimensional CNN". The diagram within this section is crucial for visualizing the data flow: Input -> FC Layer -> Reshape -> CNN Layers -> Output. Also, briefly review the "coding it" section to understand the hyperparameters involved, such as sign_size (the sequence length) and cha_input (the number of channels).
From Word Sequences to Feature Sequences
This entire process is analogous to how 1D CNNs are used in Natural Language Processing, a domain you've worked in. In NLP, a sentence is first converted into a sequence of word embeddings. This creates a (sequence_length, embedding_dim) matrix. A 1D CNN then slides its kernels across the sequence of words to detect n-grams and local semantic patterns.
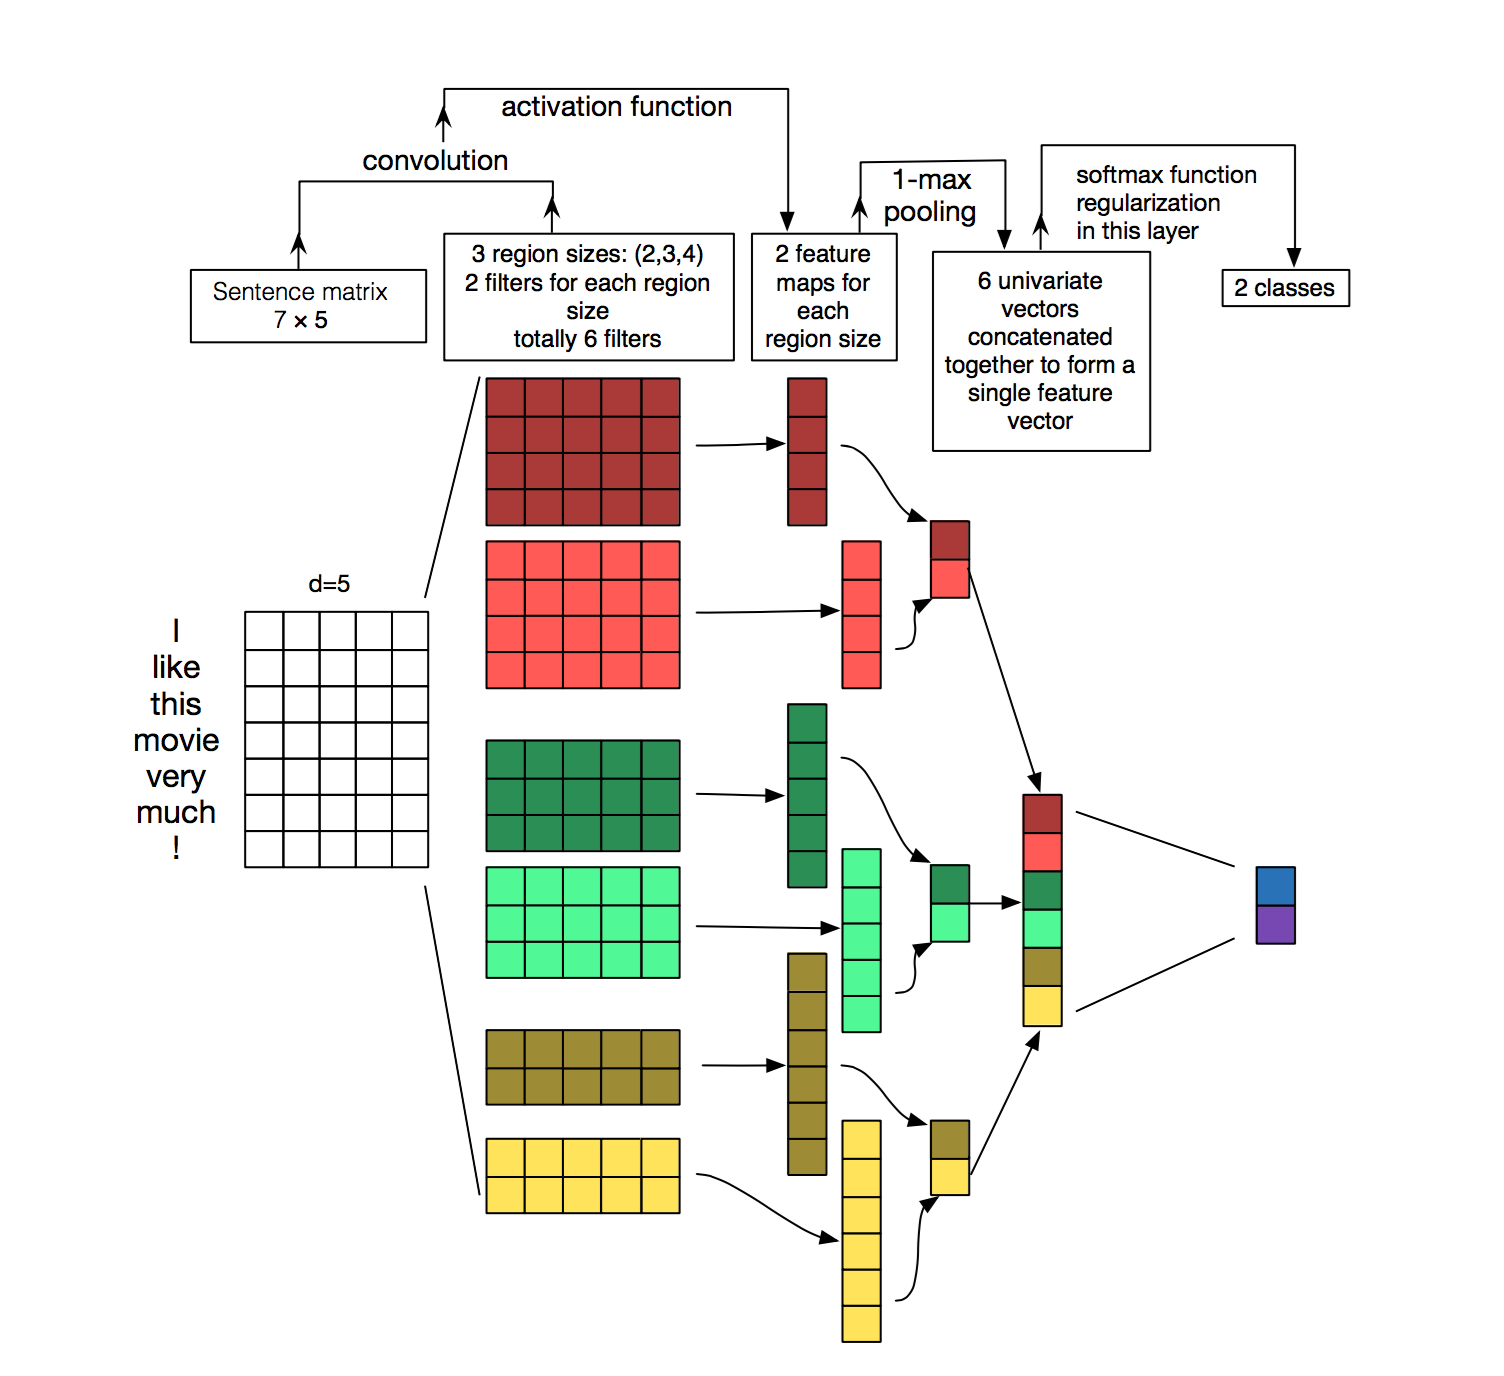
In our case, the "soft-ordering" (FC layer + reshape) creates a tensor of (num_channels, pseudo_sequence_length). Each channel is like a "sentence" composed of learned feature combinations, and the 1D CNN's job is to read these sentences and extract meaningful patterns.
Performance and When to Use 1D CNNs
This method is not just a theoretical curiosity; it has demonstrated strong empirical performance. It provides a way for the model to automatically discover and exploit high-order feature interactions.
There are two primary scenarios where you would apply 1D CNNs to tabular-style data:
-
Inherently Sequential Data: For data that already has a natural order, such as time series (e.g., stock prices, sensor readings) or genomic sequences, you can skip the soft-ordering trick. Here, you would typically create a feature matrix from lagged variables (e.g., price at
t-1,t-2, etc.) and apply the 1D CNN directly along the time/sequence axis. The model will learn patterns like local trends, momentum, and volatility. -
General Tabular Data: For datasets with no inherent order, the Soft-Ordering 1D CNN is the way to go. It creates the necessary structure for the convolutions to be effective.
Let's look at the performance of these models in practice.
Convolutional Neural Networks on Tabular Datasets (Part 1)
The article concludes with a practical benchmark and summary.
Read the "Hands-on" and "Conclusions" sections. Note how the SoftOrdering1DCNN performs against a standard MLP and is competitive with LightGBM, a top-tier gradient boosting model.
Furthermore, a comparative study on financial asset forecasting highlights the strength of 1D CNNs on volatile, time-series data, which aligns with your interest in finance.
Comparison of Linear Regression, MLP, 1D CNN, and ...
This research paper offers insights into using 1D CNNs for financial forecasting.
Focus on the results. In section 3.2, examine Table 1. Notice how the MLP and 1D CNN outperform other models on the highly volatile Bitcoin (BTC) data, suggesting their non-linear modeling capacity is particularly useful here. Also, in the Conclusion (Section 4), the paper reiterates that the CNN was beneficial for the more erratic series.
The key insight is that the hierarchical nature of CNNs allows them to build up complex feature representations from simple, local patterns. For a time series, this could mean learning a "local dip" feature, then a "dip-followed-by-spike" feature, and so on. For general tabular data, the patterns are more abstract but the principle of building complex interactions from simpler, learned groupings remains the same.
Conclusion
In this lesson, we have successfully adapted a cornerstone of computer vision—the Convolutional Neural Network—to the domain of tabular data. By moving beyond simple feature selection (as in TabNet) to automated feature interaction learning, you've added another advanced, non-obvious technique to your arsenal.
Key Takeaways:
- 1D Convolutions: Are powerful for extracting local patterns from any sequential data.
- The Ordering Problem: Applying 1D CNNs to general tabular data is challenging because the feature order is usually arbitrary.
- Soft-Ordering Solution: A large fully-connected layer followed by a reshape operation can learn to group and order features into "pseudo-sequences," creating a meaningful structure for convolutions to operate on.
- Automatic Feature Interaction: This architecture allows the model to automatically learn hierarchical and complex interactions between features, acting as a powerful, end-to-end feature engineering engine.
- Dual Applicability: 1D CNNs can be used directly on inherently sequential data (like time series) or on general tabular data via the soft-ordering technique.
Interview Alert
Question: "You're given a tabular dataset. When might you consider using a 1D CNN instead of a more traditional model like XGBoost or a different neural architecture like TabNet?"Your Answer: "I'd consider a 1D CNN in two main scenarios. First, if the data is inherently sequential, like financial time series or event logs. Here, a 1D CNN can directly learn temporal patterns like trend, seasonality, and volatility from lagged features, which might be more effective than how a tree-based model handles such correlations. Second, for a general tabular dataset where I suspect complex, high-order feature interactions are important, I could use the 'soft-ordering' technique. This involves using a fully-connected layer to project features into a high-dimensional space and then reshaping them to create pseudo-sequences. This allows the CNN to act as an automatic feature interaction learner. Compared to TabNet, which focuses on selecting salient features, the CNN focuses on creating new, complex features from combinations of the original ones. While XGBoost is a powerful and fast baseline, a 1D CNN might capture interaction patterns that are difficult for trees to model, especially if those interactions have a local, sequential nature after the soft-ordering."
Preview of the Next Lesson:
We have now covered supervised (TabNet) and semi-supervised (1D CNNs for feature extraction) deep learning methods. What if you have a massive amount of unlabeled data? In our next lesson, we will explore contrastive self-supervised learning for tabular data, using methods like VIME (Variational Information Maximization for Explanations). You'll learn how to pre-train a model to generate meaningful feature embeddings without using any labels at all, which can then be fine-tuned for a downstream supervised task.