Recommended resources
The freely available resources this lesson will direct you to.

Welcome back. You’ve defined the café campaign’s primary customer action: complete and pay for a weekday lunch pickup order. The goal is 40 such orders through campaign-tagged ordering links in four weeks. But an order is not worth its full selling price to the café: ingredients, packaging, and payment fees consume part of the revenue.
This lesson turns that observation into three numbers you can use before setting an ad budget: contribution margin, break-even return on ad spend (ROAS), and an initial allowable acquisition cost. They will help you distinguish “the campaign generated orders” from “the café can afford what it spent to generate them.”
What is left from one order?
Suppose a typical qualifying lunch pickup order brings in $15, excluding tax and tips. The café estimates these costs for each additional order:
| Per-order item | Amount |
|---|---|
| Customer payment for lunch | $15.00 |
| Ingredients | $5.00 |
| Packaging | $0.50 |
| Payment processing | $0.50 |
The three costs total $6. They are variable costs in this scenario: the café expects to incur them when it fulfils another order. The amount left is the contribution margin per order:
That $9 is not yet profit. It is available to pay for advertising, help cover fixed costs such as rent, and, if anything remains, contribute to profit. Rent does not normally increase each time one more lunch is sold, so it is not subtracted as a per-order variable cost here. If fulfilling extra orders does require additional paid labour per order, that incremental labour belongs in the estimate.
Watch Contribution Margin from Edspira for the distinction between the money left after variable costs and final profit.
Edspira’s “Contribution Margin” introduces the calculation with a product sale, then shows why the result is not the same as net income.
Watch the sale example for selling price less variable costs. Continue with the income statement, focusing on how contribution margin first covers fixed expenses. You can stop when the presenter turns to later break-even topics.
Different orders may have different costs. A discount changes the amount the customer pays; an unusually expensive dish changes ingredient cost. For an initial estimate, use a clearly stated typical order, then revisit the numbers if the actual mix of orders differs.
The contribution margin ratio expresses the $9 as a share of the $15 sale:
In other words, under these assumptions, each dollar of lunch revenue leaves about 60 cents after the listed per-order costs. This percentage lets you connect order economics to an advertising metric measured in revenue.
From order margin to break-even ROAS
ROAS means return on ad spend. It is revenue associated with ads divided by ad spend—not profit divided by ad spend:
A ROAS of 2 means $2 in measured revenue for every $1 spent on ads. Whether that is enough depends on the margin. If only 60% of revenue remains after variable costs, $2 of revenue leaves $1.20 to pay for each $1 of advertising. If only 40% remains, that same $2 leaves just $0.80.
At ad-only break-even, the contribution margin from the measured orders equals the ad spend. For the café’s typical $15 order, that means it could spend up to $9 per additional order before that order’s contribution is exhausted. Its break-even ROAS is therefore:
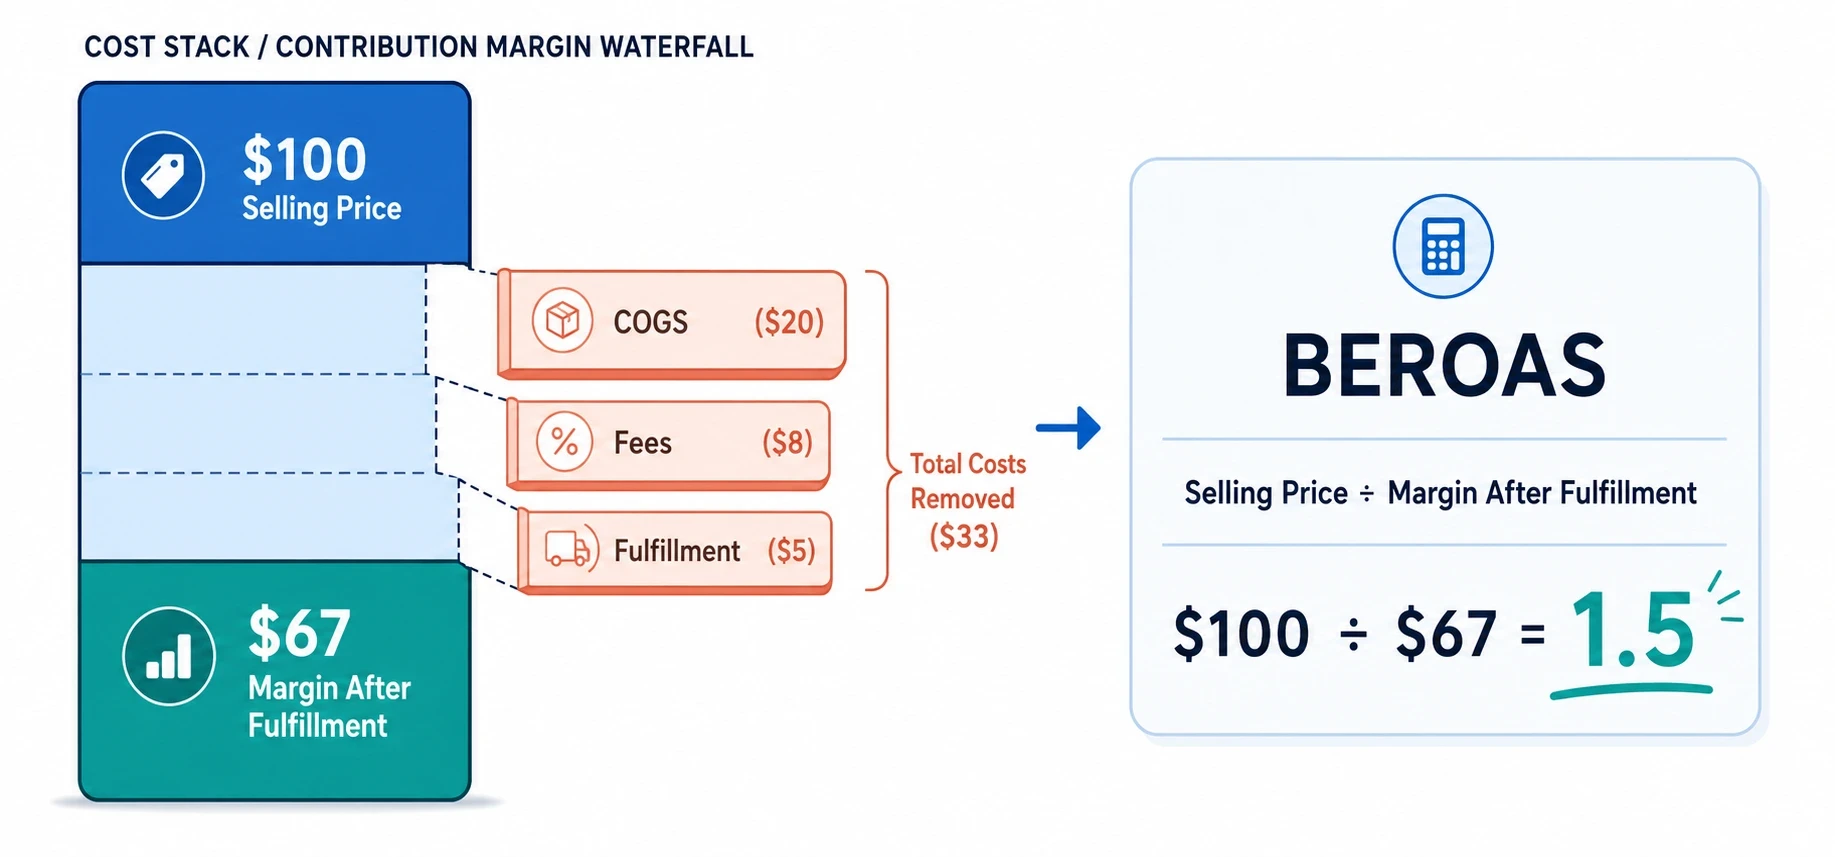
The image below shows the same cost-stack logic with a different product. Its $100 selling price less $33 in listed costs leaves $67; $100 divided by $67 is approximately 1.49, shown as 1.5 when rounded.
Read Shopify’s Break-Even ROAS Calculator for a second numerical example and its checklist of costs that are easy to omit. Shopify calls the percentage used in its formula a “gross profit margin”; for this lesson, we call the percentage after all relevant per-order variable costs the contribution margin ratio.
Break-Even ROAS Calculator: How To Measure Break-Even ROAS (2026) - Shopify
Shopify connects costs per sale to the ROAS required to cover ad spend. Read its cost checklist and the worked calculation, rather than the surrounding promotional material.
Under “How to calculate break-even ROAS,” start with the paragraph beginning “To determine an accurate break-even ROAS” and read the cost checklist through the final “Pick and pack fees” bullet. Then read the worked example from the paragraph beginning “The break-even ROAS calculation requires” through the explanation after the $100 sale. Notice how a change in the percentage left from sales changes the required ROAS.
For the café, a measured ROAS below about 1.67 would not cover both the assumed per-order costs and ad spend. At about 1.67, it covers those items but leaves nothing from those orders for rent or profit. Above 1.67 leaves some contribution after advertising; it does not automatically mean the whole business is profitable.
Set an initial allowable acquisition cost
Break-even tells you a ceiling, not necessarily what you want to pay. If the café spent the full $9 margin to obtain a $15 order, it would keep nothing from that order toward fixed costs or profit. A cautious initial plan might reserve $3 of the $9 and allow $6 for advertising:
At $6 in ad spend for one additional $15 order, the implied ROAS is $15 divided by $6, or 2.5. The $3 reserve is a planning choice, not a universal rule. It gives the café some room for overhead, profit, or an imperfect cost estimate.
The learning goal calls this an allowable acquisition cost, so there is one more distinction to make. Customer acquisition cost (CAC) concerns the cost of obtaining a new customer; cost per order concerns an order. They are the same number only under a stated assumption—for example, if each new customer acquired by this campaign makes exactly one qualifying order during the period.
Under that simplifying assumption, the café’s initial allowable CAC is $6 per new customer. If the 40-order objective were met by 40 additional, first-time customers, the corresponding initial ad budget would be:
Those 40 orders would bring in $600 in revenue. After $240 in estimated per-order variable costs and $240 in ads, $120 would remain toward fixed costs and profit. This is a forecast under the stated assumptions, not a promise of $120 in net profit.
If some of the 40 orders come from existing customers, they still count toward the stated paid-order objective, but they are not 40 new customer acquisitions. You would need a new-customer count to calculate actual CAC. Likewise, you should not raise the allowable first-order CAC on the assumption that customers will buy again unless you have evidence for those repeat orders. The $6 figure is a sensible starting limit for a one-order acquisition, to be revised when better information is available.
Know what the numbers can—and cannot—claim
A useful calculation depends on consistent inputs. Use the actual amount received for the qualifying order after any discount, not an undiscounted menu price. Include costs that rise with an additional order, and make sure your revenue and cost estimates describe the same kind of order. If the café adds a delivery service later, a pickup-order margin may no longer apply.
There is also a measurement limit. Campaign-tagged ordering links can show which recorded orders used those links; they do not prove that every linked customer bought because of the ad. Some might have ordered anyway, while someone who saw the ad might order through another route. For now, treat the calculations as unit economics and planning thresholds, not proof of advertising’s incremental effect.
The three figures answer different questions:
- $9 contribution margin per order: What remains from a typical $15 lunch order after its estimated variable costs, before ads and fixed costs?
- About 1.67 break-even ROAS: What minimum revenue-to-ad-spend ratio covers those variable costs and ads under the same assumptions?
- $6 initial allowable acquisition cost: What might the café choose to spend for one additional first order while reserving $3 of its contribution?
Takeaways
Start with selling price minus all relevant variable costs to find contribution margin. Divide that margin by selling price to get the contribution margin ratio; its reciprocal is the ad-only break-even ROAS. Finally, set an initial allowable cost below the per-order margin if the business needs some of that margin for other expenses or profit. State whether your limit is per order or per new customer, because the two are not always interchangeable.
Next, you’ll turn from affordability to responsibility: identifying misleading claims, missing disclosures, privacy risks, and harmful targeting before an advertisement reaches customers.