Recommended resources
The freely available resources this lesson will direct you to.

Hello! Welcome back to our investigation of the Van der Waals model.
In our last lesson, we discovered that for temperatures below the critical temperature , the Van der Waals (vdW) isotherm develops a non-monotonic "S-shaped" loop. We established that the portion of this loop with a positive slope, , is thermodynamically unstable. The physical resolution is that the system undergoes phase separation, with the unstable loop being replaced by a horizontal line on the P-V diagram, representing a state of liquid-gas coexistence at a constant pressure, .
This leaves us with a crucial question: for a given temperature , how do we determine the exact pressure at which this coexistence occurs? Today's lesson is dedicated to answering this. We will introduce and derive the Maxwell equal-area construction, a powerful and elegant method for pinpointing the equilibrium coexistence pressure. By applying this construction, we can begin to map out the boundary of the two-phase region, known as the coexistence curve.
The Thermodynamic Condition for Phase Equilibrium
Before we jump to the graphical construction, let's establish the fundamental thermodynamic principle that governs phase coexistence. When two phases, like a liquid (l) and a gas (g), are in equilibrium, they must satisfy three conditions:
- Thermal Equilibrium: They are at the same temperature, .
- Mechanical Equilibrium: They are at the same pressure, .
- Chemical Equilibrium: They can exchange particles, so they must have the same chemical potential, .
The first two conditions are straightforward—they simply mean our two phases must lie on the same horizontal line on a P-V isotherm. The third condition is the key that will allow us to locate the correct horizontal line.
The following short excerpt from David Tong's lecture notes formalizes the condition of chemical equilibrium that we will use as the starting point for our derivation.
Please read the brief subsection '5.1.1 Phase Equilibrium'. Note that since the Gibbs free energy per particle is the chemical potential (g = G/N = \mu), the condition \mu_{liquid} = \mu_{gas} is the same as g_{liquid} = g_{gas}.
From Chemical Potential to a Graphical Rule
Our task is to translate the condition into a practical rule on the P-V diagram. To do this, we use the fundamental thermodynamic relation for the Gibbs free energy, . For a system with a fixed number of particles at a constant temperature , this simplifies. Since , we have . The relation becomes , or:
where is the volume per particle (or molar volume).
Now, let's integrate this expression along the vdW isotherm, from the liquid state (at volume , pressure ) to the gas state (at volume , pressure ).
The path of this integration follows the full S-shaped vdW loop. The condition for equilibrium is that , which means the integral must be zero:
This integral represents the area of the cycle on a V-P plot (with P on the x-axis). It is more intuitive to work with the standard P-V diagram. Using integration by parts, , the cycle integral becomes:
Since the path is a closed loop, . This leaves us with .
Let's be more explicit. The closed loop consists of two parts: (1) moving from to along the vdW isotherm, and (2) moving back from to along the horizontal line at .
Flipping the limits of the second integral gives:
Combining the integrals, we arrive at the final result:
This equation is the mathematical statement of the Maxwell equal-area construction. It says that the coexistence pressure must be chosen such that the net area between the vdW isotherm and the horizontal coexistence line is zero. Graphically, this means the area of the loop above the line must exactly equal the area of the loop below it.
Applying the Maxwell Construction
Let's now visualize this rule.
This short video clip provides a clear, animated explanation of the equal-area construction.
Please watch from 11:28 to 12:38. The video directly explains how to position the tie-line by ensuring the two portions of the phase loop have equal area.
The construction gives us a practical, graphical procedure for correcting the unphysical vdW isotherm:
- For a given temperature , plot the isotherm .
- Draw a horizontal line at a test pressure .
- Calculate the two areas enclosed between the line and the vdW curve.
- Adjust the height of the horizontal line until these two areas are equal. This height is .
- The points where this line intersects the isotherm define the equilibrium volumes of the saturated liquid () and saturated gas ().
The images below provide a static view of this construction.
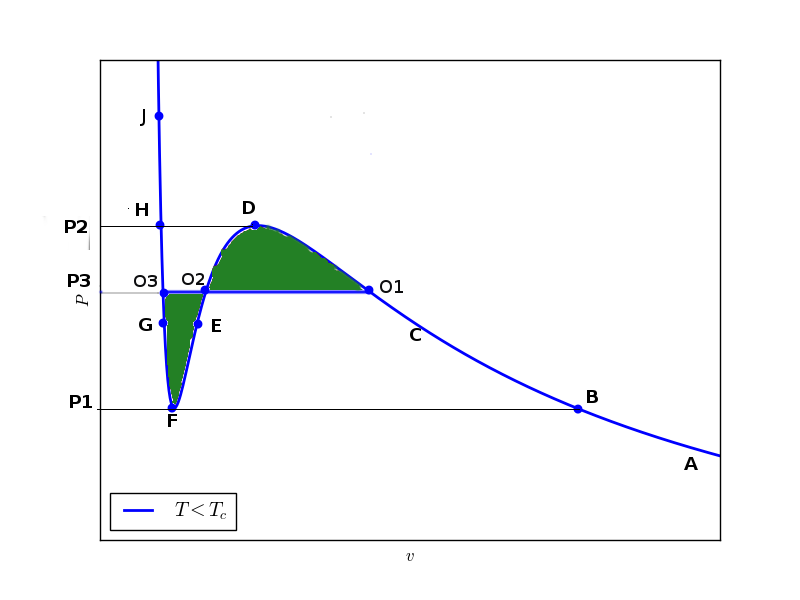
The Maxwell construction has a direct and elegant correspondence with the Helmholtz free energy analysis from our last lesson. The condition of equal areas on the P-V diagram is mathematically equivalent to the common tangent construction on the A-V diagram. Both methods identify the same equilibrium state, which minimizes the system's free energy.

[PDF] Thermodynamic Properties of the van der Waals Fluid
For a rigorous walkthrough of the derivation that explicitly connects the Gibbs free energy to the equal-area rule on the P-V diagram, this resource is excellent. It uses a slightly different but equivalent path to the one we took above.
Please read the subsection labeled 'Maxwell's construction' on page 15, which begins just after Figure 10. Pay close attention to Figure 11 and its caption, as they provide a clear visual argument for why the two areas must be equal, starting from the condition \Delta\mu = 0.
Test your understanding!
Consider the Maxwell construction shown in the image "Maxwell Construction on a P-V Isotherm" above. What would happen to the areas if we chose a pressure line slightly higher than ? Would the area of the top loop be larger or smaller than the area of the bottom loop? How does this relate to the stability of the phases?
Show answer
If we chose a pressure line higher than , the area of the bottom loop (liquid-like region) would increase, while the area of the top loop (gas-like region) would decrease. The area below the line would be larger than the area above it.
This corresponds to a state where , meaning . In this situation, the gas phase is more stable (has a lower chemical potential) than the liquid phase. The system would not be in equilibrium; any liquid present would spontaneously evaporate to become gas to lower the overall free energy. The reverse is true for a pressure line chosen below . Only at are the chemical potentials equal, allowing the two phases to coexist stably.
The Coexistence Curve
The true power of the Maxwell construction becomes apparent when we apply it repeatedly. For each temperature , we can perform the construction to find the unique coexistence pressure and the corresponding liquid and gas volumes, and .
If we plot the locus of these liquid and gas volume points on the P-V plane for all temperatures up to , we trace out a dome-shaped boundary. This boundary is the liquid-gas coexistence curve.
- Any state inside this curve is unstable as a single phase and will separate into a mixture of saturated liquid and saturated gas.
- Any state outside this curve exists as a stable, single phase (liquid on the left, gas on the right).
The corrected vdW phase diagram therefore replaces all the internal loops with horizontal tie-lines bounded by this coexistence curve.
The following text and figure from David Tong's notes beautifully illustrate the result of applying the Maxwell construction across all temperatures.
Please read the text following the derivation of the Maxwell construction, starting from 'For each isotherm, we can determine the pressure...'. Pay close attention to Figure 37, which shows the final, physically correct phase diagram with the coexistence curve and the flat isotherms inside it.
Conclusion
Today, we have bridged the gap between fundamental thermodynamic principles and a practical method for describing phase coexistence in the Van der Waals model. By demanding that the coexisting liquid and gas phases have equal chemical potential, we derived a simple but profound graphical rule.
Key Takeaways:
- The condition for phase equilibrium between a liquid and a gas is .
- This condition is mathematically equivalent to the Maxwell equal-area construction on the P-V diagram, which states: .
- Graphically, this means the coexistence pressure is found by drawing a horizontal line that cuts off equal areas above and below the vdW loop.
- Applying this construction at a series of temperatures allows us to map out the coexistence curve, which is the boundary of the two-phase region in the phase diagram.
Preview of the Next Lesson:
The coexistence curve, which we will also call the binodal curve, marks the boundary of true thermodynamic equilibrium. However, the original vdW loop also contained regions that were locally stable but not globally stable (metastable states) and points marking the absolute limit of that local stability. In the next lesson, we will define and plot both the binodal curve and the spinodal curve (the limit of metastability) to build a complete and nuanced phase diagram, explaining the physical significance of each.