Recommended resources
The freely available resources this lesson will direct you to.
Hello! Welcome back.
In our last lesson, we derived the Maxwell equal-area construction, which allowed us to correct the unphysical parts of the Van der Waals (vdW) isotherms and determine the equilibrium coexistence pressure for a given temperature . By tracing the equilibrium liquid and gas volumes, and , across different temperatures, we mapped out the coexistence curve.
Today, we will formalize our understanding of this phase diagram by introducing two crucial boundaries: the binodal curve and the spinodal curve. We'll see that the coexistence curve we derived is the binodal curve, which marks the limit of absolute thermodynamic stability. We will then define the spinodal curve, which marks the limit of local stability (or metastability). By plotting both curves, we will create a complete phase map that distinguishes between stable, metastable, and unstable regions, and we will explore the distinct physical processes that occur in each.
The Binodal and Spinodal Curves
Let's begin by formally defining these two curves.
-
The Binodal Curve: This is simply another name for the coexistence curve. It is the locus of points and that are in thermodynamic equilibrium, as determined by the Maxwell construction at each temperature . A system with an average volume and temperature that places it inside the binodal curve will, at equilibrium, separate into two phases (liquid and gas) whose individual properties lie on the binodal curve.
-
The Spinodal Curve: This curve marks the limit of local mechanical stability. Recall that a stable or metastable state must have a positive compressibility, meaning . The spinodal curve is defined as the locus of points on the vdW isotherms where this condition is on the verge of being violated, i.e., where the isotherm is perfectly flat:
These are the minimum and maximum points of the uncorrected vdW loop.
The following brief text from David Tong's lecture notes clearly defines these two curves and shows their relationship on the P-V diagram.
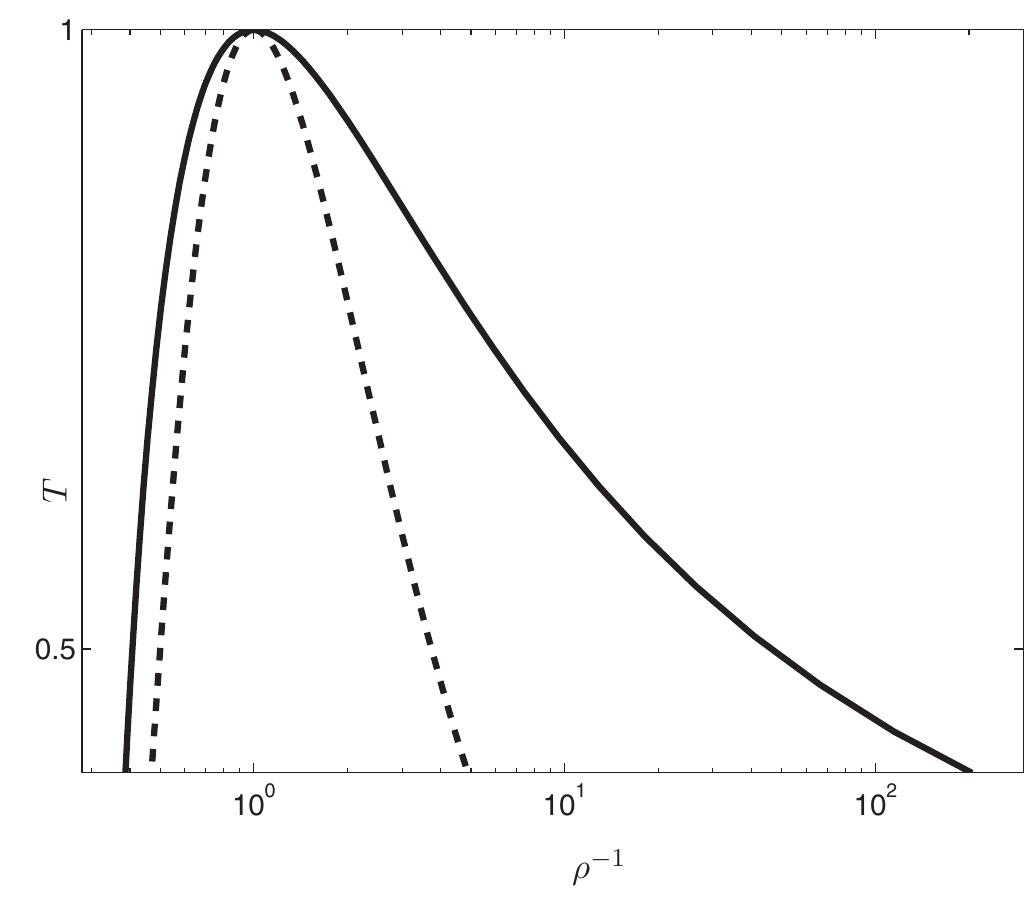
Please read the short subsection titled 'Meta-Stable States'. Pay close attention to Figure 39, which shows the vdW isotherm with the coexistence curve (outer dotted line) and the spinodal curve (inner dotted curve).
The resulting phase diagram, shown in various coordinate systems, now has three distinct regions.
Physical Significance: Stability and Decomposition
The binodal and spinodal curves are not just mathematical constructions; they divide the phase diagram into regions with profoundly different physical behavior. The key difference lies in how a homogeneous system, when placed in one of these regions, proceeds toward its true equilibrium state of two separate phases.
- Region I (Outside the binodal): Stable. A single phase (liquid or gas) is the true, unique equilibrium state.
- Region II (Between binodal and spinodal): Metastable. A homogeneous single phase is not the state of lowest free energy, but it is locally stable. Think of it as a ball resting in a small divot on the side of a large valley. A small nudge won't dislodge it, but a large enough "kick" will send it rolling down to the valley floor (the true equilibrium). Examples include superheated liquid (a liquid heated above its boiling point at a given pressure without boiling) and supercooled vapor (a gas cooled below its condensation point without liquefying).
- Region III (Inside the spinodal): Unstable. A homogeneous phase is locally unstable. The ball is now perched on the top of a hill; any infinitesimal perturbation will cause it to roll down.
The mechanism of phase separation is different in the metastable and unstable regions.
Mod-01 Lec-21 Spinodal decomposition
This excellent video explains the concepts of stability from a free energy perspective and connects them to the mechanisms of phase separation. While the presenter uses the language of binary alloys (free energy G vs. composition x), the principles are identical for our single-component fluid (Helmholtz free energy A vs. volume V). The second derivative of free energy determines the stability in both cases.
Please watch the following two segments: 1:31 - 10:07: This part explains how the sign of the second derivative of free energy (d^2G/dx^2) distinguishes stable, unstable, and metastable regions, and defines the spinodal points where this derivative is zero. For our vdW fluid, the analogous quantity determining stability is (\partial^2 A / \partial V^2)_T = -(\partial P / \partial V)_T. 17:42 - 35:23: This segment contrasts the two phase separation mechanisms. For a state between the binodal and spinodal (metastable), it explains nucleation and growth. For a state inside the spinodal (unstable), it describes spinodal decomposition.
To summarize the video's key points in the context of our vdW fluid:
-
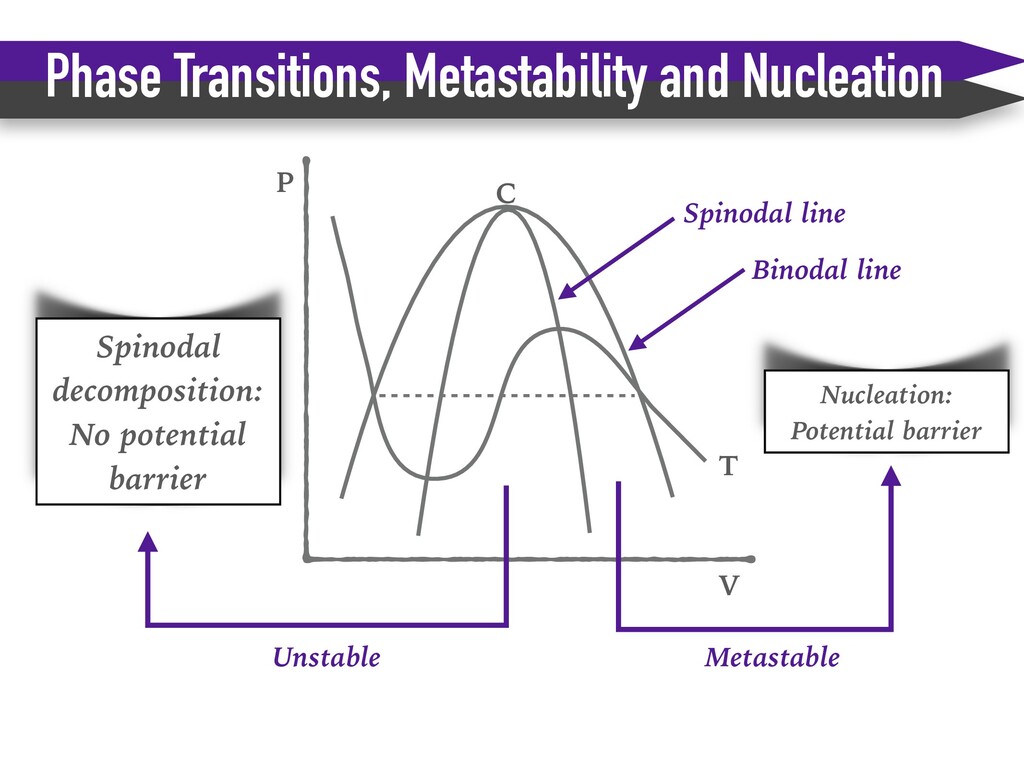
Nucleation and Growth (Metastable region): To escape a metastable state, the system must overcome an energy barrier. This happens via a rare, large, random fluctuation that forms a sufficiently large droplet of the more stable phase (e.g., a liquid droplet in a supercooled vapor). This "critical nucleus" then grows, consuming the surrounding metastable phase. This process is typically slow and happens at specific, heterogeneous sites (like dust particles or container walls).
-
Spinodal Decomposition (Unstable region): Inside the spinodal, there is no energy barrier to phase separation. Any infinitesimal, long-wavelength fluctuation in density is energetically favorable and will grow spontaneously and exponentially. This leads to a rapid, homogeneous decomposition of the entire system into an interconnected, sponge-like structure of the two separating phases, which then coarsens over time.
The following image provides a great visual summary of these concepts on a single diagram.
The Free Energy Landscape
The concepts of stability, metastability, and instability are most rigorously understood by looking at the shape of the free energy function. For the vdW fluid at constant T, the relevant potential is the Helmholtz free energy, .
- Stable/Metastable states: In these regions, the free energy curve is convex (curves up), meaning . This is the condition for local stability.
- Unstable states: In this region, the free energy curve is concave (curves down), meaning . This guarantees instability.
- Spinodal points: These are the inflection points where the curvature is zero, , separating the convex and concave parts.
Since we know that , we can see the direct link:
Thus, the unstable region corresponds exactly to the concave, unstable part of the free energy curve.
[PDF] van der Waals gas - bingweb
The following resource provides an exhaustive look at the vdW phase diagram, including excellent plots of the free energy and the resulting spinodal/binodal curves.
This is a rich resource with many figures. Please focus on the following: Figure 39 on page 62: This plot explicitly shows the calculated 'bimodal lines' (binodal) and 'spinodal lines' on a Temperature vs. Volume diagram. This is a direct visualization of our learning outcome. Figures 46, 47, and 49 on pages 72-75: These phase diagrams show the binodal and spinodal curves and clearly label the metastable regions ('Super-heated state', 'Super-cooled state'). The text explains how reaching these states depends on the rate of cooling or heating. The final glossary on page 93: Note the definitions provided for 'Binodal line' and 'Spinodal line'.
Test your understanding!
Imagine you have a vdW fluid in a piston, held at a temperature . You start with the fluid as a gas at a very large volume. You then slowly compress the piston, decreasing the volume at constant temperature. Describe the sequence of states the system passes through, referencing the binodal and spinodal curves. What would be different if you compressed it extremely rapidly?
Show answer
Slow Compression (approximating equilibrium):
- Stable Gas: Initially, at large volume, the system is in the stable gas region, outside the binodal curve. Pressure increases as volume decreases.
- Enters Coexistence Region: When the volume reaches the gas-side of the binodal curve (), the gas becomes saturated. As you compress further, the system enters the two-phase coexistence region. The pressure remains constant at , and liquid begins to condense out. The system becomes a mixture of liquid and gas.
- Fully Liquid: As you continue to compress at constant pressure, more and more gas turns into liquid. When the volume reaches the liquid-side of the binodal curve (), all the gas has condensed. The system is now entirely in the stable liquid phase.
- Stable Liquid: Further compression results in a very rapid increase in pressure, as the liquid is nearly incompressible.
Rapid Compression (quenching):
- Stable Gas: Same as above.
- Enters Metastable Region: If you compress rapidly past the binodal curve, the system may not have time to form the stable liquid nuclei. It can enter the metastable region between the binodal and spinodal curves, becoming a supercooled vapor.
- Enters Unstable Region: If you compress so rapidly that you cross the spinodal curve, the system becomes mechanically unstable. It will then undergo spontaneous, chaotic spinodal decomposition into a complex mixture of liquid and gas phases, rapidly collapsing toward a state inside the equilibrium coexistence region.
Beyond the Ideal Model: The Coherent Spinodal
The NPTEL video you watched discussed the phase separation of alloys, a prime example from condensed matter physics. In solid systems, unlike fluids, density (or composition) fluctuations are coupled to elastic strain in the crystal lattice. A region that becomes richer in one component might have a different natural lattice spacing, creating stress against the surrounding matrix.
This strain energy costs free energy and acts to suppress fluctuations, making phase separation harder. The result is that the "chemical spinodal" (the one we derived from ) is not the full story. The true instability only sets in at a lower temperature, where the driving force for separation is strong enough to overcome the energy penalty from elastic strain. This defines a coherent spinodal curve, which lies inside the chemical spinodal. This is an important concept in materials science and demonstrates how the fundamental principles we're learning are extended to describe more complex, real-world systems.
Conclusion
In this lesson, we have added critical detail to our understanding of the liquid-gas phase transition. By distinguishing between the boundaries of global equilibrium and local stability, we have constructed a more complete and physically meaningful phase diagram.
Key Takeaways:
- The binodal curve is the coexistence curve found via Maxwell's construction. It encloses the two-phase equilibrium region.
- The spinodal curve is the locus of points where . It encloses the region of absolute mechanical instability.
- The region between the binodal and spinodal curves corresponds to metastable states (e.g., superheated liquid, supercooled vapor). These states decay via nucleation and growth, which requires overcoming an energy barrier.
- The region inside the spinodal curve is unstable. States here decay via spinodal decomposition, a spontaneous, barrierless process driven by the growth of infinitesimal fluctuations.
- These stability criteria are directly related to the curvature of the free energy function.
Preview of the Next Lesson:
The binodal and spinodal curves meet at a single, special point: the critical point. In our next lesson, we will mathematically locate the critical point of the Van der Waals fluid and calculate the critical constants () in terms of the vdW parameters and . This will be a crucial step toward understanding universal behavior near criticality.