Recommended resources
The freely available resources this lesson will direct you to.
Hello! Last lesson, you defined a metric precisely enough that another analyst could reproduce it. That precision matters even more when several metrics are connected: a persuasive-looking diagram can conceal mismatched units, reporting windows, or populations.
Today you will build a metric tree. It starts with an organisational objective, identifies a measurable result that represents progress, and works down to the drivers that help explain or improve that result. We will continue with the delivery example, then consider how the same method transfers to another sector.
Start with the objective, not a collection of KPIs
Suppose a delivery service has this objective: more customers should receive their two-day orders as promised, without shrinking the service to make performance look better. A candidate headline metric is the weekly number of eligible two-day orders fully delivered by their promised deadlines. It measures fulfilled customer promises at a meaningful scale.
The headline is not the whole objective. A higher count could result from handling many more orders even while the share delivered on time gets worse. We will therefore keep the late-delivery rate from the previous lesson alongside it.
Amplitude’s North Star Playbook introduces a customer-value metric at the top of a tree and a small set of inputs beneath it. Read its explanation and grocery-delivery example for the distinction between the result an organisation wants and the factors teams can work on.
The guide to discovering your product's North Star
Read the opening framework explanation, the grocery-delivery example, and the later advice on choosing inputs. Focus on why a useful top-level metric and its inputs need definitions, rather than merely appealing names.
In Chapter 1, “About the North Star Framework” (printed p. 7), start with the paragraph beginning “The North Star Framework is a product management model” and read the framework through the introduction of key inputs. Continue in “North Star Framework elements” (p. 8), from “The heart of the North Star Framework” through the grocery example and actionable inputs. Finally, find “Getting your inputs right” (p. 27); read from “Inputs are the handful of factors” to the reminder that each input needs a name and definition in this passage.
A North Star is one way to choose a focus metric, particularly in product settings. It is not a requirement that every organisation use that label or reduce every decision to one number. For an analyst, the essential question is more practical: Which measured outcome represents the stated objective, and what measurable factors sit beneath it?
Separate arithmetic components from possible influences
There are two importantly different ways a lower-level metric can connect to a higher-level one.
A component is part of an accounting identity. If weekly eligible orders are counted consistently, their number equals the number of customers with at least one such order multiplied by the average eligible orders per such customer. That equality holds because of the definitions.
An influence is a proposed relationship that might help change a component. Reminder messages might increase ordering frequency; better dispatch processes might improve the on-time rate. Neither statement is true by definition, and neither tells you the size of an effect without evidence.
Watch the construction portion of Designing & Building Metric Trees by AI Council. Concentrate on its distinction between components and influences; that distinction determines whether you can reconcile a branch mathematically or must treat it as a relationship to investigate.
Designing & Building Metric Trees
Watch “Designing & Building Metric Trees” for a method of building from a top-level metric down to components and then adding influences.
Watch choosing the top for the starting point, two input types for mathematical components versus contingent influences, and metric metadata for the dimensions and relationship notes that make a tree usable. In the revenue example, check whether quantities such as “average selling price” are defined at a grain that makes the claimed equality hold.
This distinction is an analytical safeguard. A component branch can be checked against the source data. An influence branch is an informed proposition, not proof that changing one metric will cause another to move.
Build a delivery tree whose components reconcile
Use the same population and period as the previous lesson: genuine, dispatched two-day orders, assigned to a completed week by their promised deadline. Each eligible order counts once. An order is on time only if it was fully delivered by that deadline; otherwise it is late, including when it remains undelivered.
Define four weekly quantities:
- : number of eligible orders whose promises came due.
- : number of distinct customers with at least one of those orders.
- : average number of those orders per such customer, calculated as .
- : fraction of those orders fully delivered on time.
Let be the weekly number of on-time orders. The first layer of the tree is:
The order-volume branch has another exact breakdown:
Together, they give the compact tree:
Read that last expression as three measurable components of the headline: customers with orders due, eligible orders per such customer, and the on-time fraction of those orders. These are identities for the specified week and population, not claims that acquiring a customer or changing a delivery process will have a particular causal effect.
The previous lesson’s late-delivery rate, , uses the same eligible orders. Because every such order is classified as on time or late under these rules, . It is an alternative view of the reliability branch, not an additional independent driver.
Suppose 200 customers have 240 eligible orders due this week, and 30 orders are late. Then , , and:
This reconciliation is a useful test of the tree. If your calculated components produce 210 but your headline report shows 226, investigate the definitions or joins before interpreting the apparent performance.
The grain rules still apply. If , is undefined; do not manufacture an average of zero to make the multiplication appear valid. If you split customers into “new” and “returning,” those categories need a mutually exclusive rule before their counts can be added back to .
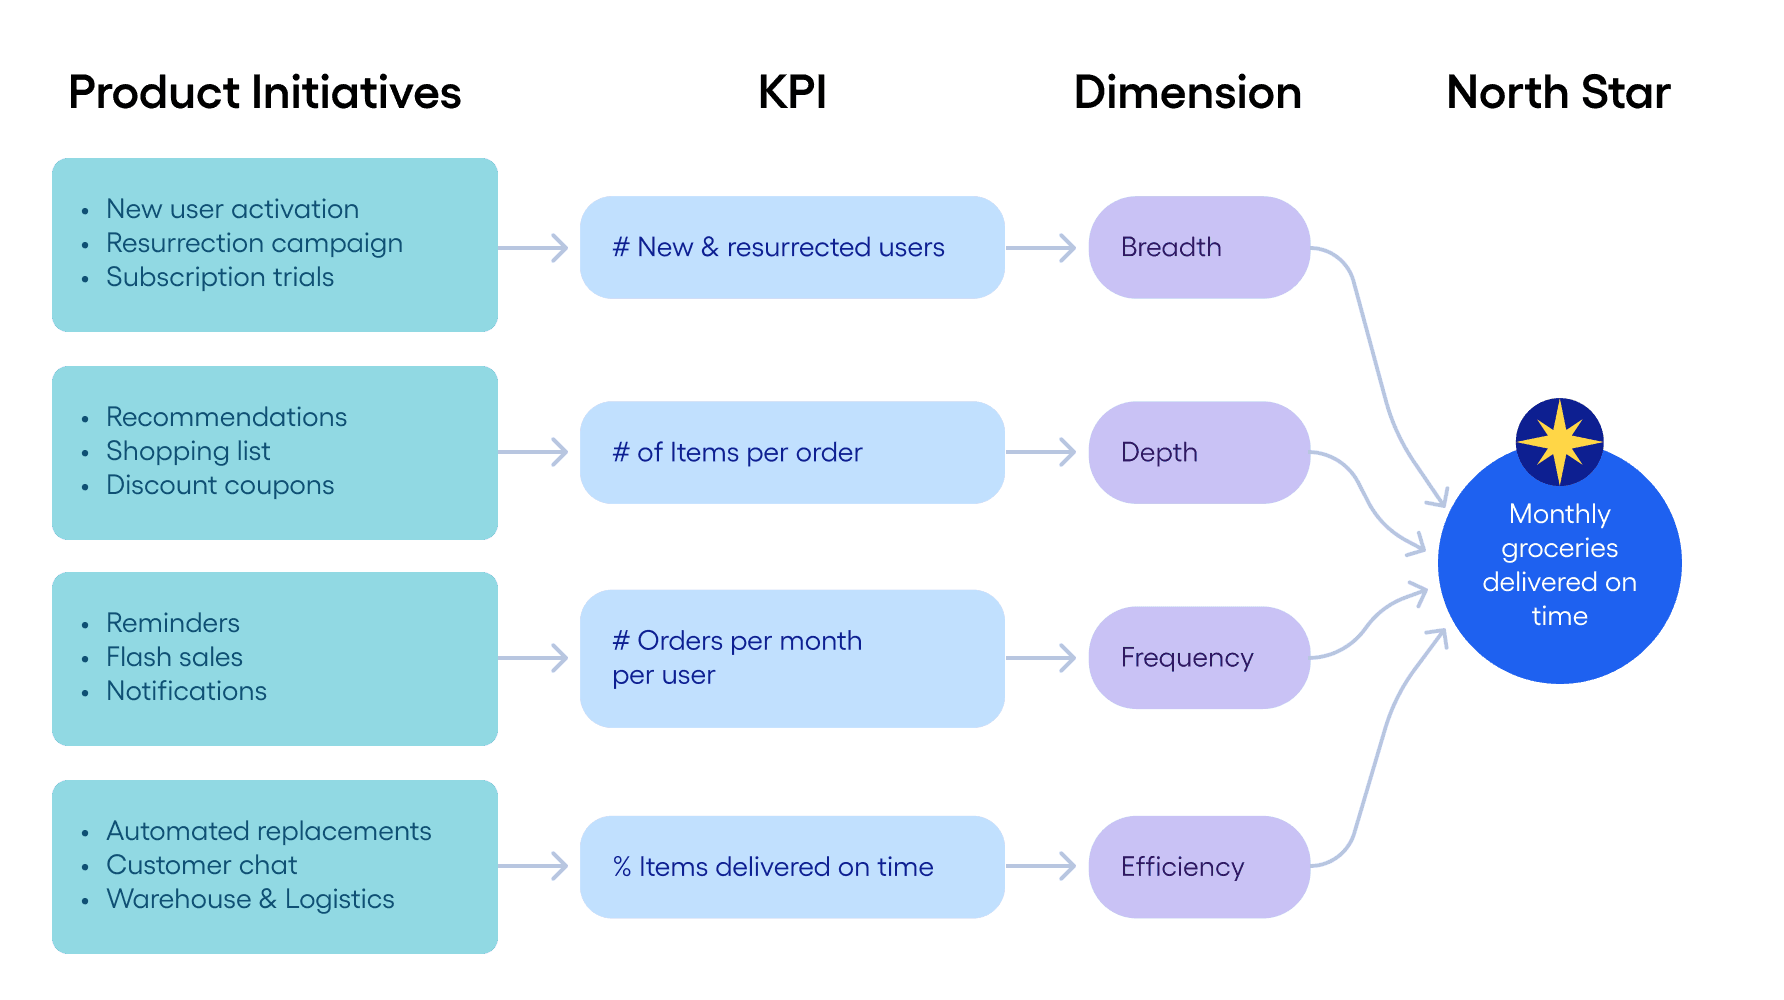
The image provides another way to organise the ideas. Its top metric concerns groceries, while our worked metric counts orders. Items per order would belong in an arithmetic breakdown of on-time items only after defining how items enter the period and how the on-time percentage is calculated. You cannot insert it into the order-count formula merely because it appears relevant. A metric tree is useful when its labels can be turned into compatible calculations—or are clearly marked as non-arithmetic influences.
Add drivers a team could investigate or change
The component tree tells you where a movement occurred. It does not yet tell you what work might improve it. Add a few candidate influences beneath the components, keeping them visibly distinct from the identities:
- Beneath , a team might monitor the number of customers making their first eligible order and the number returning after a prior eligible order. A campaign is an intervention; customers with orders due is the measured result it might affect.
- Beneath , a team might monitor repeat-order behaviour. Reminders could be one proposed way to change it, but reminder sends are not themselves eligible orders.
- Beneath , an operations team might monitor fulfillment delays or carrier handoff times. These may help explain missed promises, but improving a handoff metric does not guarantee a particular increase in .
Choose inputs that are sufficiently close to the objective to matter and sufficiently specific to investigate. “Messages sent” is measurable but can rise without any customer ordering more. “Weekly eligible orders per customer with an order due” is closer to the desired behaviour, although it can still change for reasons unrelated to reminders. A promotion could increase while putting enough pressure on capacity to reduce . The tree makes that trade-off visible instead of hiding it inside a single headline.
A workable tree therefore records, for each important connection, what kind of connection it is. Mark exact component relationships as identities; mark proposed influence relationships as assumptions to check. You can also note the likely direction, reporting cadence, and relevant dimensions—such as fulfillment location for —without implying that an observed association establishes causation. Formal hypotheses and success criteria come later in this module.
Check that the tree represents success, not just growth
Consider a second week with 300 eligible orders and 45 late orders. The headline rises to 255 on-time orders, up from 210. Yet the late-delivery rate rises from 12.5% to 15%, so reliability worsens. Both statements are true. Which matters most depends on the original decision, which is why the objective must remain visible above the tree.
For this objective, review together with or its complement, . Also watch for changes to the eligible population: a service should not appear more reliable merely because it cancels or reclassifies difficult two-day orders before dispatch. Cancellation volume and the share of orders offered two-day service may be useful accompanying checks. These measures need not all be forced into the arithmetic formula for ; they protect its interpretation.
Before treating a tree as ready for analysis, make four checks:
- Traceability: Can you explain how each lower-level metric relates to the stated objective?
- Reconciliation: Do branches presented as identities calculate back to their parent using the same population, grain, and window?
- Actionability: Are proposed influences measurable and close enough to a decision that someone could investigate them?
- Balance: Could the headline improve while customer experience or another important outcome worsens? If so, identify a companion measure.
The method is industry-agnostic. For a service organisation, “cases resolved by their service deadline” could be broken into cases due in the period and the fraction of those cases resolved on time. Case volume could be examined by customer group; resolution performance by case type or team. The same discipline applies: define what counts as a case, which deadline assigns it to a period, and whether a lower branch is an exact component or only a possible influence.
Key takeaways
A metric tree connects an organisational objective to a defined focus metric, its measurable components, and the potential influences worth investigating. Exact components should reconcile; proposed influences should not be presented as guaranteed effects. Keep the counting unit, population, and reporting window consistent, and use companion measures when a headline can improve for the wrong reason.
Next, you will identify the data fields needed to answer a defined analytical question. This tree gives you a starting inventory: to calculate and investigate its branches, you will need to find the underlying order, customer, promise, delivery, and operational data.