Recommended resources
The freely available resources this lesson will direct you to.
Hello! Last lesson, you translated a stakeholder request into a decision, an analytical question, and a deliverable. The next step is to identify what kind of answer that question asks for. “Where are deliveries late?” and “Would an extra packing shift reduce lateness?” may concern the same orders, but they require different evidence.
This lesson gives you a practical way to classify questions as descriptive, diagnostic, predictive, or causal. The distinction will help you choose an appropriate analysis—and, just as importantly, avoid promising a conclusion your data cannot support.
Classify the answer being requested
A useful first pass is to ask what the stakeholder wants to know:
| Question type | Core question | Delivery example |
|---|---|---|
| Descriptive | What happened, or what is true of the observed data? | What proportion of two-day orders arrived late last month? |
| Diagnostic | Where or among whom did an observed pattern arise, and what might account for it? | Which locations and delivery stages account for the rise in late orders? |
| Predictive | What outcome is likely for a specified future or otherwise unknown case? | Which orders are likely to arrive late, based on information available at dispatch? |
| Causal | What difference would changing something make? | Would adding a packing shift reduce late deliveries? |
Watch the opening of Descriptive vs Diagnostic vs Predictive vs Prescriptive Analytics: What’s the Difference? from Maven Analytics for a quick orientation. The video uses prescriptive for choosing a course of action; our four-category framework instead includes causal questions about the effects of actions. A recommendation may draw on several kinds of analysis, so do not treat “prescriptive” as a substitute for “causal.”
Descriptive vs Diagnostic vs Predictive vs Prescriptive Analytics: What's the Difference?
Maven Analytics introduces several common purposes for analysis and cautions against treating them as a ladder of increasing value.
Watch the definitions for the distinctions among describing, diagnosing, and predicting. Then watch the caveat: these approaches work together rather than replacing one another.
Classify the question by the claim its answer must support, not by the tool used. A Power BI report can describe a monthly rate or help investigate an unexpected change. A Python model can predict an outcome without estimating the effect of an intervention. “We used regression” tells you less about the question than “We want to know whether changing this policy would alter the outcome.”
Descriptive and diagnostic: from a pattern to an investigation
A descriptive analysis establishes the observed state of affairs. It might report that 13% of eligible orders arrived late over the last eight completed weeks, show a weekly trend, or compare rates across locations. It can be quite sophisticated: careful definitions, reliable data, and sensible comparisons all matter. Its claim remains bounded by what was measured: this is what the recorded orders show.
A diagnostic question starts with something that calls for explanation. Suppose lateness rose from one period to the next. You might compare packing time with time after carrier handoff, examine whether the rise is concentrated in certain locations, and check whether the mix of order types changed. The purpose is not merely to produce more charts. It is to work out which observed differences account for the pattern, or to narrow a set of plausible explanations.
Read the diagnostic section of 8 Types of Data Analysis for a compact example of investigating an unusual change in website traffic.
Built In’s example shows how an analyst moves from noticing a change to looking for its source.
In “Types of Data Analysis,” find subsection “2. Diagnostic Analysis,” immediately after the descriptive example. Read the diagnostic explanation and footwear example, from the first bullet about investigating a finding through the final sentence about other possible contributors. Notice that the category breakdown helps explain where the traffic difference appeared while the discussion of seasonality and sales events leaves room for alternative explanations.
That last distinction matters. Suppose one fulfillment location accounts for most of the additional late orders. This is diagnostically useful: the location deserves closer investigation. It does not, by itself, prove that its staffing caused the increase. Perhaps its order volume grew, its orders became more complex, or carrier service changed. To investigate responsibly, compare rates as well as counts and keep competing explanations visible.
The boundary between descriptive and diagnostic can be subtle because both may use the same grouped table. “Show late-delivery rates by location” is descriptive if the aim is to report rates. “Which locations account for last month’s increase in the overall late-delivery rate?” is diagnostic: the breakdown is being used to investigate a specified change. The purpose of the comparison, not the presence of a chart or filter, determines the classification.
Predictive: estimate an unknown outcome
A predictive question asks for an outcome that is not yet known at the point when the answer will be used. An operations team might ask which orders are likely to miss their promised dates so it can prioritize attention. An energy provider might estimate next week’s demand. A service team might estimate which incoming cases will require additional support.
Prediction requires a clearly defined unit and decision point. “Predict late delivery” is incomplete until you know whether the prediction is made when an order is placed, when it leaves the warehouse, or when the carrier receives it. The available information differs at each point. A prediction intended to support dispatch decisions must use information available by dispatch, not a timestamp recorded after delivery.
Read the descriptive, predictive, and causal passages of The Art of Data Science. Its taxonomy includes additional question types; for now, concentrate on the distinctions relevant to this lesson.
This chapter explains why the type of question governs how an analytical result should be interpreted.
In Section 3.1, “Types of Questions,” read the opening and descriptive definition, ending with the paragraph about summarizing a dataset. Farther down the same section, find the paragraph beginning “A predictive question would be one where you ask…” and read the predictive example through its final sentence about predictors. Finally, find the paragraph beginning “A causal question asks…” and read the causal explanation through the discussion of randomized and nonrandomized data. Focus on why a useful predictor need not be a cause.
That point is operationally important. Suppose orders from a particular location are often late. The location may help predict lateness even if the true operational problem is a carrier route serving that location. A prediction can help flag at-risk orders; it does not establish that moving orders to another location would improve delivery.
Causal: ask what changing an action would change
A causal question concerns an intervention and its effect. Compare these two questions:
- Predictive: Among customers already enrolled in a rewards program, who is likely to purchase again?
- Causal: If we encourage otherwise comparable customers to enroll, will their subsequent purchasing increase?
The first concerns forecasting. The second asks what would happen under an action. Imagine enrolled customers spend an average of 80 units and non-enrolled customers spend 50. The observed difference is 30 units. It may reflect an effect of enrollment, but it may also reflect customers who were already frequent purchasers choosing to enroll.
In statistical terms, an observed group comparison such as
need not equal the average effect of assigning the action,
Here indicates whether the customer enrolled, while and represent purchasing under enrollment and non-enrollment for the same kind of customer. We cannot ordinarily observe both outcomes for one customer. A credible causal analysis needs a design that addresses that missing comparison—for example, an appropriately run randomized test, or a carefully justified observational approach. You will study experimental evidence later in the course; for this lesson, the essential skill is to recognize when a question demands it.
The supplied image makes the limitation of correlation concrete:
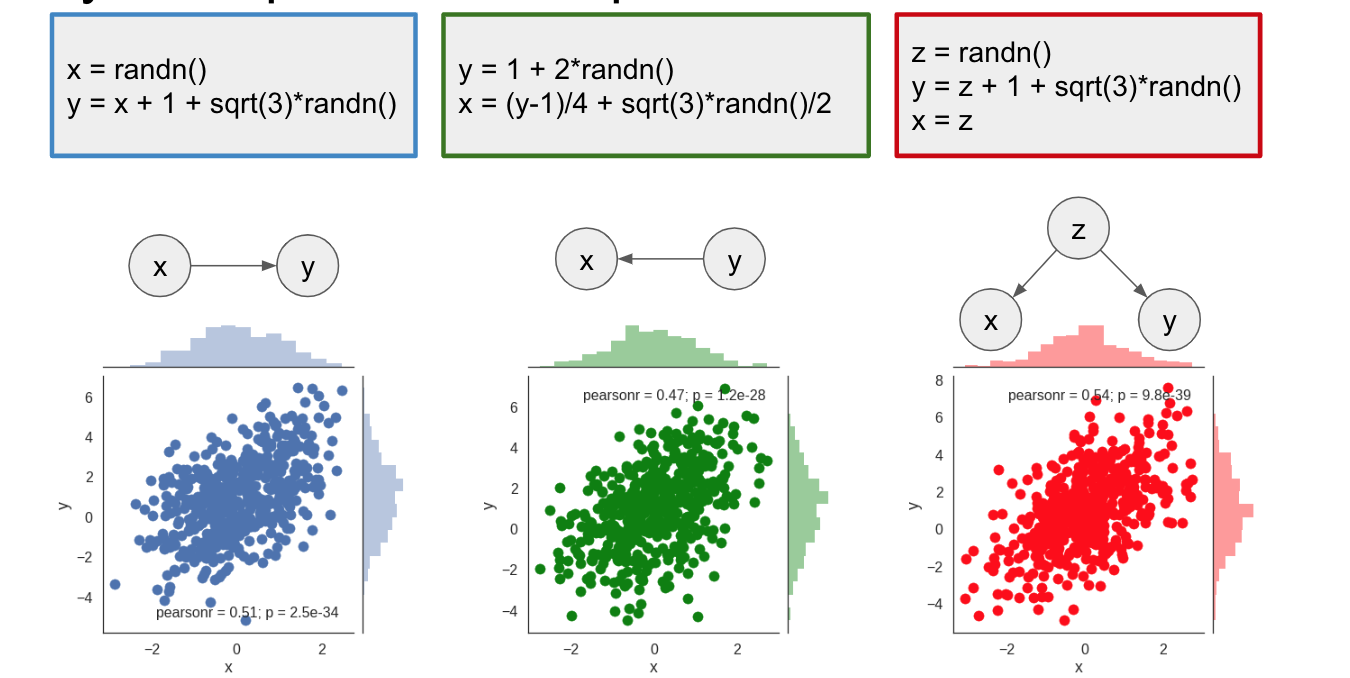
If represents rewards enrollment and represents purchases, an upward-trending scatter plot does not tell you whether enrollment increases purchasing, purchasing encourages enrollment, or another factor influences both. The image’s equations specify different ways the plotted data could arise; you do not need to calculate them to see the central point. An association describes what varies together. A causal claim concerns what would change if you intervened.
This also clarifies the word why. “Why did the overall late-delivery rate rise?” might mean “Which observed locations or stages account for the increase?”—a diagnostic investigation. But “Did the staffing change cause the rise?” asks for the effect of a particular change and is causal. When the wording is ambiguous, clarify what the stakeholder expects the answer to establish.
Classify the question before choosing the method
Return to the packing-shift decision from the previous lesson. A sensible investigation might involve several questions, each serving a different purpose:
- Descriptive: How many orders were late, and how did the late-delivery rate change over eight weeks?
- Diagnostic: Was the increase concentrated before carrier handoff, after handoff, or in particular locations or carriers?
- Predictive: Which orders about to be dispatched are most likely to arrive late, if the team needs to prioritize follow-up?
- Causal: If an additional packing shift were introduced, how much would it change the late-delivery rate compared with not introducing it?
These are not stages that every project must complete. If the immediate decision is where to investigate a bottleneck, descriptive and diagnostic work may be sufficient. If the decision is which individual orders to contact today, prediction is more relevant. If the stakeholder needs to know whether to fund a packing shift because it will reduce lateness, they are asking for causal evidence. A diagnostic finding can motivate a trial of that shift, but it should not be reported as proof of the shift’s effect.
A quick classification test is to finish this sentence: “An answer would allow us to say…”
- “…what was recorded” suggests descriptive.
- “…where a change arose or which observed factors may explain it” suggests diagnostic.
- “…what is likely for a case whose outcome is unknown” suggests predictive.
- “…what difference an action would make” suggests causal.
A stakeholder may ask more than one of these at once. Rather than forcing the entire request into a single label, separate its questions and state what evidence each answer would require. That keeps a useful investigation from quietly turning into an unsupported causal claim.
Key takeaways
Classify an analytical question by the claim the stakeholder needs, not its dataset, chart, or algorithm. Descriptive questions summarize observations; diagnostic questions investigate an observed pattern; predictive questions estimate unknown outcomes; and causal questions ask what an intervention would change. The same business problem can contain all four, but each answer has different limits.
Next, you’ll make those questions more precise by defining a business metric: its formula, grain, dimensions, and reporting window.