Recommended resources
The freely available resources this lesson will direct you to.
- Observability and Evals for AI Agents: A Simple Breakdownwww.youtube.com
- Arize AI Phoenix: Open-Source Tracing & Evaluation for AI (LLM/RAG/Agent)www.youtube.com
- LLM Observability: The Ultimate Guide for AI Developers - Cometwww.comet.com
- The complete guide to LLM observability for 2026 - Portkeyportkey.ai
Introduction
In our last lesson, we established the fundamental architectural differences between a "demo" prototype and a "service" production system. A key pillar of that production-ready architecture is observability—the ability to understand the internal state of your agentic system from its external outputs. print() statements and ad-hoc debugging simply don't scale when you are responsible for a client's business process.
This lesson drills down into the core of observability. We will move beyond acknowledging its importance to defining precisely what it entails. Your goal for this lesson is to identify the critical metrics and data to log for production agent systems, including prompts, responses, tool interactions, and token usage.
This is not just about collecting data; it's about collecting the right data to create a high-fidelity record of your agent's behavior. This record becomes the source of truth for debugging, evaluation, performance tuning, and cost management—the essential activities of running a reliable AI service.
1. The Determinism Gap: Why Traditional Monitoring Falls Short
With your background in computer science, you're deeply familiar with Application Performance Monitoring (APM). In traditional software, if a function returns a 200 OK status with low latency, you can be highly confident it worked correctly. The system is deterministic.
LLM-based systems break this contract. An agent can be "healthy" by all traditional metrics—fast response time, no server errors—while providing a factually incorrect, irrelevant, or unsafe answer. This is the determinism gap. Traditional APM monitors the container (Is the server running?), but LLM observability must monitor the content and reasoning (Was the answer good, and why was it chosen?).
This video from LangChain's co-founder, Harrison Chase, provides an excellent introduction to this shift in thinking.
Observability and Evals for AI Agents: A Simple Breakdown
This video explains why the non-deterministic nature of agents requires a new approach to observability, where the 'trace' of what happened becomes more important than the code itself.
Watch from the beginning to 03:37. Pay close attention to the contrast between deterministic software, where code is the source of truth, and agentic systems, where traces are the source of truth. Notice the emphasis on understanding the context at each LLM call.
2. The Language of LLM Observability: Traces, Runs, and Threads
As the video highlighted, the fundamental unit of analysis in LLM observability is the trace. While traditional logs are a flat, chronological list of events, a trace is a structured, hierarchical representation of the entire causal chain of a single request.
To build a solid mental model, let's define the key primitives using the concepts from the video you just watched:
- Run: A single unit of execution. Most commonly, this is a single LLM call, a tool execution, or a retrieval step. A run captures the inputs, outputs, and metadata of that specific step.
- Trace: A collection of runs, organized hierarchically, that represents the full end-to-end execution of a task. It shows how the output of one run becomes the input for the next, revealing the agent's decision-making path.
- Thread: A sequence of traces that form a multi-turn conversation or interaction. This is crucial for debugging issues where context from an earlier turn affects behavior in a later one.
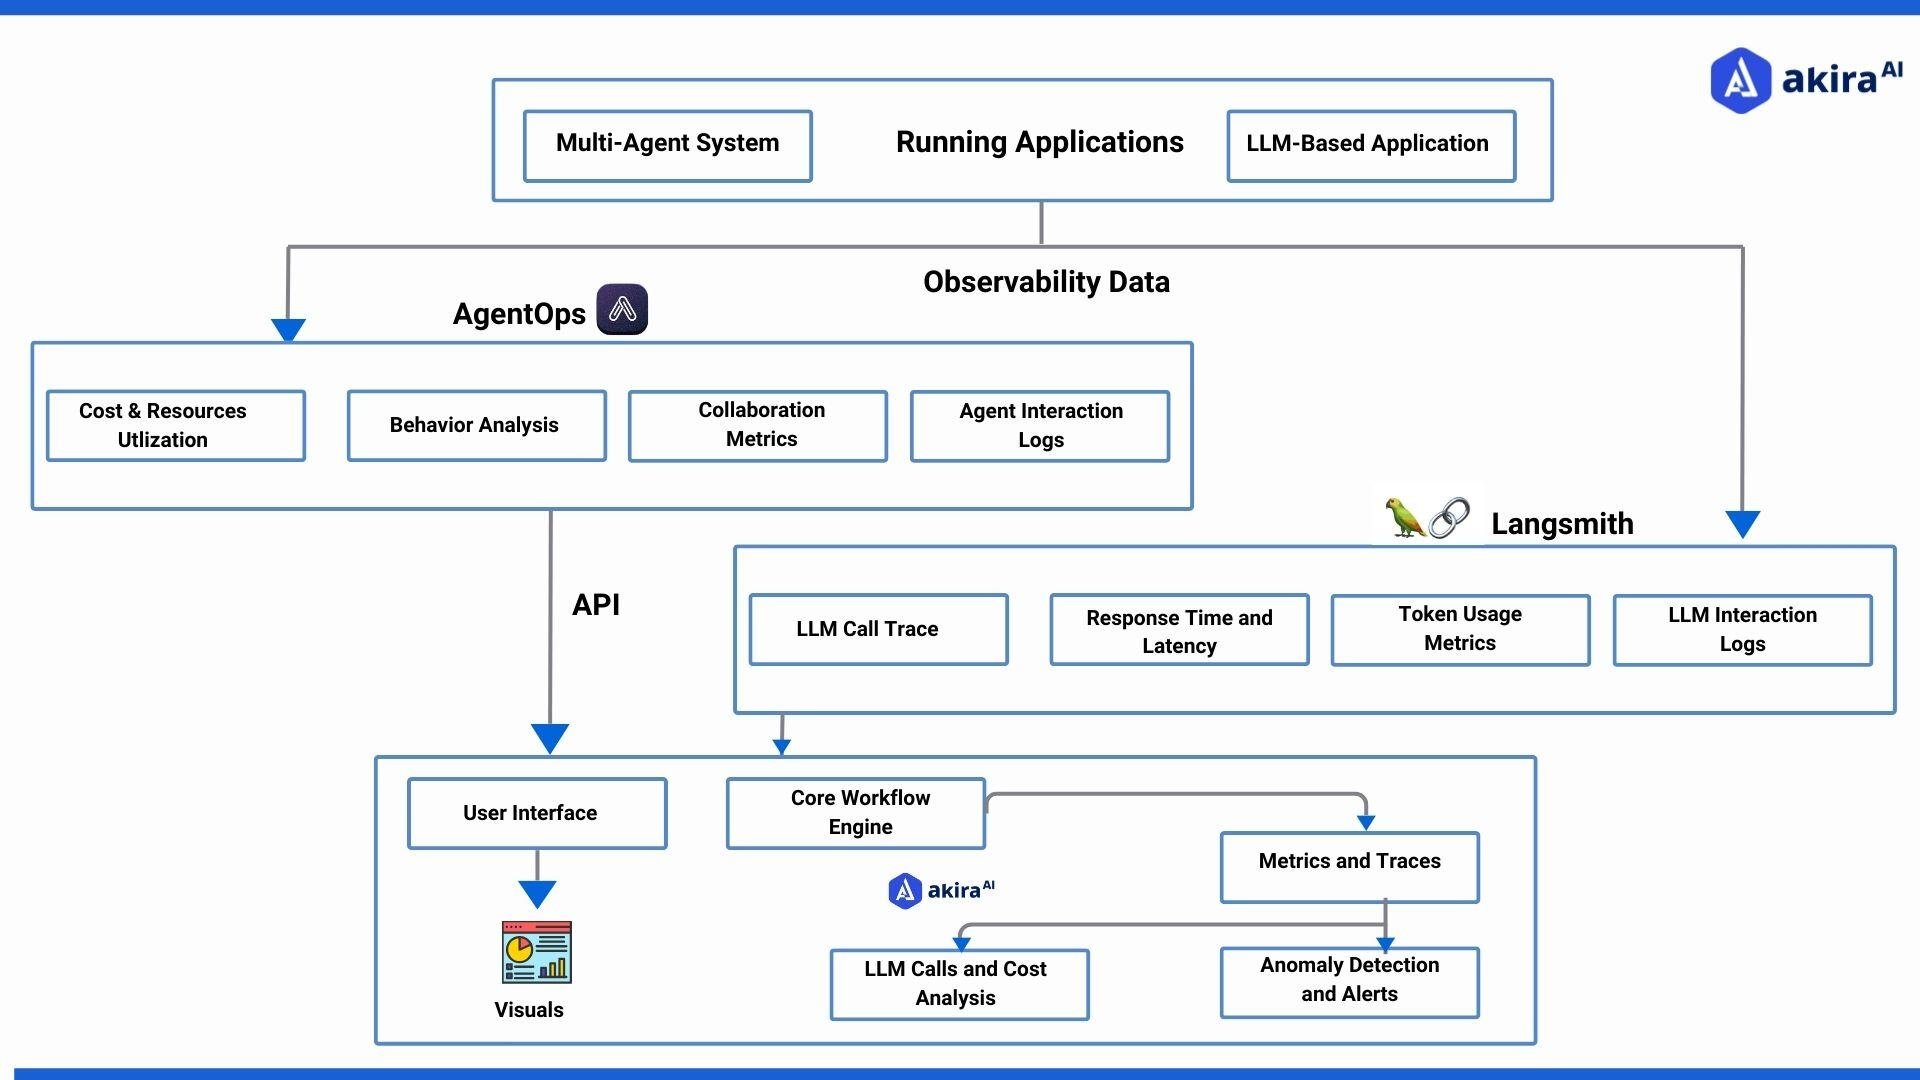
3. A Three-Layer Framework for Logging
To decide what to log, it's helpful to categorize observability into three distinct layers. This framework ensures you capture not just operational health, but also quality and reasoning.
LLM Observability: The Ultimate Guide for AI Developers - Comet
The article 'LLM Observability: The Ultimate Guide for AI Developers' from Comet provides an excellent three-layer model for thinking about what data to collect.
Read the section 'The three layers of LLM observability'. Focus on understanding the distinction between Computational, Semantic, and Agentic observability. This will serve as our organizing principle for the logging checklist.
To summarize the three layers:
- Computational Observability: The "how much." This covers resource utilization, cost, and speed.
- Semantic Observability: The "how good." This evaluates the quality and relevance of the inputs and outputs.
- Agentic Observability: The "why." This tracks the agent's internal reasoning, planning, and decision-making.
4. The Definitive Logging Checklist for Production Agents
With our framework in place, let's build a comprehensive list of the critical data points to log. A robust observability platform will capture these automatically through instrumentation.
This table synthesizes best practices from leading observability platforms and research.
| Layer | Category | Critical Data Points to Log | Why It's Critical |
|---|---|---|---|
| Identification | Correlation | trace_id, span_id, parent_span_id, user_id, session_id, thread_id |
Foundation: Allows linking all steps of a complex interaction into a single, coherent view for debugging and analysis per user/session. |
| Computational | Performance | • Total latency (end-to-end) • Time-to-first-token • Latency of each span (retrieval, tool call, LLM call) • Retry counts & cache hits |
Bottleneck Analysis: Pinpoints whether slowdowns are due to the model, a tool, or data retrieval. Informs optimization strategy. |
| Computational | Cost | • Prompt/completion/total token counts per LLM call • Aggregated token counts per trace • Calculated cost per request, per user, per day |
Unit Economics: Essential for calculating the ROI of the agentic workflow, setting client pricing, and preventing budget overruns. |
| Semantic | LLM Interaction | • Model provider, name, and version (gpt-4-turbo-2024-04-09) • Full prompt sent to the model (including system prompt and context) • Raw LLM response received • All model parameters ( temperature, top_p, stop_sequences, seed) |
Reproducibility & Debugging: The exact inputs/outputs are vital for debugging semantic failures (e.g., hallucinations, prompt drift) and reproducing issues. |
| Semantic | User Feedback | • Explicit feedback (thumbs up/down, user-provided score) • Implicit signals (e.g., user rephrased the query, user copied the answer) |
Ground Truth for Quality: The ultimate measure of success. Essential for building evaluation datasets and fine-tuning. |
| Agentic | Tool & RAG | • Tool name and input arguments passed • Raw output returned from the tool • Tool call success/failure status and error messages • For RAG: retrieved documents/chunks, relevance scores |
Debugging Execution: Isolates failures to specific tools or retrieval steps. Reveals if the agent is misusing tools or if retrieval is irrelevant. |
| Agentic | Reasoning & Planning | • Agent's internal "thought" or reasoning steps (e.g., the TAO cycle: Thought-Action-Observation) • The agent's generated plan (if using a plan-and-execute model) • Cognitive failure flags (e.g., looping, invalid tool selection) |
Debugging Cognition: This is the "black box" decoder. It shows why an agent made a decision, helping to fix flawed logic that print() statements would miss. |
| Safety | Guardrails | • PII detection flags • Toxicity scores for inputs and outputs • Jailbreak attempt detection • Verdicts from any input/output validators |
Risk Management: Provides an audit trail for compliance and helps identify bad actors or safety vulnerabilities in the system. |
For a deeper dive into these categories, especially for agent-specific metrics, the following resource provides a granular, tabular view.
The complete guide to LLM observability - Portkey
The article 'The complete guide to LLM observability' from Portkey offers a detailed breakdown of telemetry categories and specific metrics for agent observability that complement the checklist above.
Please review two sections: 'Key telemetry categories': This provides another excellent list that reinforces and expands on our checklist. 'Agent observability: measuring tools, plans, and outcomes': Focus on the table in this section. It details metrics specific to agent planning, tool use, and outcomes, which are critical for advanced agentic systems.
5. From Data to Dashboard: Visualizing Observability
Collecting this data is the first step. The second is presenting it in a way that provides actionable insights. Dashboards are the primary interface for monitoring production systems.

6. Seeing it in Action: Instrumenting a Workflow
The process of integrating an observability tool into your application is called instrumentation. Modern frameworks aim to make this as seamless as possible, often requiring only a few lines of code to start capturing the rich data we've discussed.
The following video demonstrates this process using the open-source tool Arize Phoenix. While it involves code, your focus should be on the outcome: how a simple instrumentation call results in a fully detailed trace in the user interface.
Arize AI Phoenix: Open-Source Tracing & Evaluation for AI (LLM/RAG/Agent)
This clip shows how a LangChain RAG pipeline is instrumented and how the resulting traces appear in the Phoenix dashboard, making the abstract concepts of tracing concrete.
Please watch two key segments: Launching the App (36:34 - 39:23): Watch how the Phoenix session is started, providing a URL for the observability UI. Instrumenting and Viewing Traces (49:47 - 52:30): This is the most important part. See how langchain.instrument.instrument() is called, and then observe the Phoenix dashboard populate in real-time with detailed traces as the RAG chain runs. Notice the breakdown of the trace into retriever, document chain, and LLM call, along with token counts and latency.
This practical example shows the power of structured logging. With minimal effort, the developer gains complete visibility into the RAG pipeline's execution, including the exact context sent to the LLM and the performance of each component—a process that would be incredibly difficult to debug manually.
Conclusion
In this lesson, you've learned what it means to create a comprehensive observability practice for a production agentic system. We've moved from the abstract need for monitoring to a concrete, structured checklist of what to log.
Key Takeaways:
- Observability is Multi-Layered: Effective logging covers computational (cost, latency), semantic (quality, correctness), and agentic (reasoning, planning) dimensions of your system.
- The Trace is the Source of Truth: For non-deterministic systems, a hierarchical trace of a request's lifecycle is the primary unit for debugging, not traditional flat logs.
- Log Everything That Influences the Outcome: This includes the full prompt, model parameters, tool inputs/outputs, and the agent's internal reasoning steps. You cannot debug what you do not log.
- Instrumentation is Key: Modern observability platforms can automatically capture this rich data with minimal code changes, transforming debugging from an art into a science.
You now have a blueprint for the data you need to collect. In our next lesson, we will build directly on this foundation to design a monitoring strategy using this logged data to detect system failures and performance degradation. We'll explore how to turn this raw data into actionable alerts and automated quality checks.