Recommended resources
The freely available resources this lesson will direct you to.
- Solve Many to Many Joins Using Bridge Tables - Monkey Shorts Episode 038www.youtube.com
- How to Connect Two Fact Tables (Many-to-Many) | #Power BI Course 24www.youtube.com
- Design Tip #166 Potential Bridge (Table) Detours - Kimball Groupwww.kimballgroup.com
- Advanced dimensional modeling: bridge tables and the hard cases | Data Warehouse Infodatawarehouseinfo.com
Hello! Last lesson, you used separate factless tables to distinguish an event that happened from an event that was expected. Now consider a different problem: one fact row is validly associated with several members of the same dimension. A billing event might have several diagnoses, yet its billed amount was recorded only once.
This lesson shows how to retain one billing row, represent every diagnosis through a bridge table, and define weighting rules so reports do not accidentally multiply billed amounts.
Start with the measurement, not the relationship
Suppose the business records one row per patient billing event. The fact-table grain is:
One row represents one billing event, with its total billed amount.
A billing event can have two diagnoses. Putting two diagnosis foreign keys in the fact table imposes an arbitrary limit; duplicating the billing row once per diagnosis changes the apparent amount billed. Neither is a sound way to preserve this grain.
Margy Ross’s Kimball Group article Design Tip #166 Potential Bridge (Table) Detours explains why multi-valued dimensions arise, how a bridge represents them, and where over-counting enters. Read its opening discussion before considering the design below.
Design Tip #166 Potential Bridge (Table) Detours - Kimball Group
Read this Kimball Group design tip to distinguish a multi-valued dimension from multiple fact events, and to see why a bridge alone does not make measure aggregation safe.
Below the article title, read the opening paragraph from “Dimensional designs often need to accommodate multivalued dimensions” through its concluding “cross-industry dilemma”: the examples. Continue through the paragraph beginning “A common approach for handling multivalued dimensions,” focusing on its explanation of bridge rows between a fact and dimension: the bridge pattern. Then read the paragraph beginning “The bridge table is a powerful way,” stopping just before “Here are several potential techniques to avoid bridge tables.” Focus on its warning about over-counting: the aggregation warning.
A multi-valued dimension describes several valid dimension members for one measurement event. It does not imply several measurements. That distinction determines both the schema and the meaning of its queries.
Preserve the fact row with a group bridge
The patient-billing diagram below shows three roles: a billing fact containing billed_amount and a diagnosis-group identifier; a diagnosis-group helper table containing diagnosis keys and weight factors; and a diagnosis dimension containing descriptions, types, and categories.
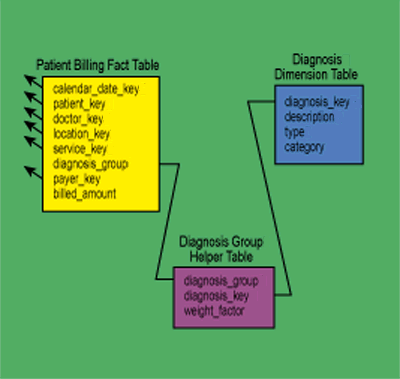
For a relational implementation, it is useful to make the group itself explicit. A minimal schema is:
billing_fact
  billing_id                 -- unique billing event
  diagnosis_group_key        -- identifies its set of diagnoses
  billed_amount

diagnosis_group
  diagnosis_group_key        -- unique group identifier

diagnosis_group_bridge
  diagnosis_group_key
  diagnosis_key
  allocation_weight
  unique (diagnosis_group_key, diagnosis_key)

dim_diagnosis
  diagnosis_key
  diagnosis_code
  description
  category
billing_fact still has one row per billing event. The bridge has a different grain: one row per diagnosis member in a diagnosis group. Its rows describe relationships; they are not additional billing events. The optional-looking diagnosis_group header in this sketch has a practical SQL purpose: it gives billing_fact.diagnosis_group_key a unique parent key, while the bridge has several rows with that key.
Consider these illustrative records, with amounts in monetary units:
| Billing event | Diagnosis group | Billed amount |
|---|---|---|
| B100 | G17 | 120 |
| B101 | G18 | 80 |
| Group | Diagnosis | Allocation weight |
|---|---|---|
| G17 | D7 | 0.75 |
| G17 | D9 | 0.25 |
| G18 | D9 | 1.00 |
B100 has two associated diagnoses, but one billed amount of 120. B101 has one diagnosis and an amount of 80. The unallocated total is therefore 200. If you join through the bridge and sum billed_amount without a rule, B100 appears twice: the result is 120 + 120 + 80 = 320. The join has multiplied rows, not created new revenue.
A group key identifies a combination of members, not an individual diagnosis. You can reuse G17 for another billing event only if its diagnosis membership and its applicable allocation policy are the same. If two events have the same diagnoses but require different splits, they need distinct group-and-weight definitions—or an event-specific bridge keyed by billing ID.
Weighting makes attribution additive
A bridge can answer two different kinds of question:
- Association: “Which billing events involved D9?” The full amount of each matching event may be shown as amount associated with D9. An event involving two diagnoses can appear in both diagnoses’ results. Those diagnosis-level amounts must not be added together as total billing.
- Allocation: “How much billed amount should be attributed to each diagnosis?” Divide each event’s amount according to an agreed business rule, then sum the allocated amounts.
For allocation, require every group’s weights to be non-negative and to sum to one:
Here is the set of diagnoses in group , and is the weight assigned to diagnosis . A single-diagnosis group has weight 1. The rule makes the allocated total reconcile to the original fact total, provided every fact references a complete group:
In the example, B100 contributes 90 to D7 and 30 to D9. B101 contributes 80 to D9. Allocated billing by diagnosis is thus 90 for D7 and 110 for D9, summing to the original 200.
The weights must represent a business-approved attribution rule, not a technical convenience. Equal shares might be appropriate for jointly credited sales representatives; they might be inappropriate for diagnoses if no meaningful clinical or financial allocation has been defined. If the business cannot justify weights, retain the bridge for association analysis, but do not label an unweighted sum by diagnosis as allocated billed amount.
This SQL exposes the weighted measure explicitly:
SELECT
    d.diagnosis_code,
    SUM(f.billed_amount * b.allocation_weight)
        AS allocated_billed_amount
FROM billing_fact AS f
JOIN diagnosis_group_bridge AS b
  ON b.diagnosis_group_key = f.diagnosis_group_key
JOIN dim_diagnosis AS d
  ON d.diagnosis_key = b.diagnosis_key
GROUP BY d.diagnosis_code;
For total billing regardless of diagnosis, query billing_fact directly:
SELECT SUM(billed_amount) AS total_billed_amount
FROM billing_fact;
These queries have deliberately different paths. A reporting model should give them different measure names and definitions; otherwise a BI tool may make an unweighted bridge join look like an ordinary, safely summable dimension join.
Weighting fixes amount attribution, not every possible count. COUNT(*) after the bridge counts diagnosis associations: this example has three. To count billing events associated with D9, filter to D9 and count distinct billing IDs. To count all billing events, count rows in the fact table. A weighted sum of billing-event indicators could express fractional attributed events, but that is not a count of whole events.
Make the rule reliable in loading and reporting
Your ETL can enforce uniqueness for (diagnosis_group_key, diagnosis_key) and a valid range for each weight. A row-level constraint cannot, by itself, ensure that all rows in a group sum to one; validate that across the loaded group. For example:
SELECT
    diagnosis_group_key,
    SUM(allocation_weight) AS total_weight
FROM diagnosis_group_bridge
GROUP BY diagnosis_group_key
HAVING ABS(SUM(allocation_weight) - 1.0) > 0.000001;
The tolerance accounts for decimal precision; choose it to match your stored weight scale. Also check for a billing fact whose group has no bridge members. If a billing event has no known diagnosis, define an explicit Unknown or Unclassified member with weight 1 if the business wants its amount included in allocated totals. Do not quietly drop the event through an inner join.
Finally, define when membership and weights are true. If diagnoses are corrected later, does a historical report reflect the diagnoses recorded at billing time or the latest corrected set? For an “as billed” report, preserve the group membership and weights used for that event rather than silently replacing G17’s contents. This is the relationship-level counterpart to the history decisions you made for dimensions: changing a shared group in place could rewrite the apparent attribution of every earlier fact that references it.
A useful reconciliation is to compare the sum of allocated amounts across all diagnosis members with the direct fact total for the same billing population. That check does not mean every diagnosis-filtered subtotal must equal total billing. A filter to D9 intentionally selects only D9’s share under the allocation rule.
Closing perspective
A multi-valued dimension calls for one fact row at the declared measurement grain and a bridge with one row per associated member. The bridge preserves the full relationship; allocation weights make measures summable across members when the weights have a defensible meaning and total one per group. Keep unallocated event totals, association measures, and allocated measures distinct in both SQL and reporting definitions.
Next, you will examine rapidly changing dimensional attributes. There, the problem is not several members attached to one fact, but how to preserve useful attribute history without allowing a large dimension to grow uncontrollably.