Recommended resources
The freely available resources this lesson will direct you to.
- LLM Hacking Defense: Strategies for Secure AIwww.youtube.com
- 10 min Walkthrough of Langfuse – Open Source LLM Observability, Evaluation, and Prompt Managementwww.youtube.com
- How to Set Up Prompt Injection Detection for Your LLM Stackneuraltrust.ai
- LLM observability guide February 2026 - Openlayerwww.openlayer.com
Hello! Welcome to the first lesson in our module on observability.
In our last session, we synthesized our knowledge of input sanitizers, runtime guards, and output filters into a cohesive, multi-layered defense-in-depth strategy. We concluded with a critical realization: even with multiple layers, determined attackers can find bypasses. This is why prevention alone is insufficient. A complete security posture must also answer the question: "How do we know when our defenses have failed?"
Today, we address that question head-on. This lesson will explain the role of observability in LLM security for threat detection and incident response. We will move beyond simply blocking attacks to understanding how to see them, analyze them, and respond to them effectively. For you, with your deep background in Site Reliability Engineering, this is about extending familiar concepts of system monitoring into the unique, probabilistic world of Large Language Models.
1. Beyond Monitoring: What is LLM Observability?
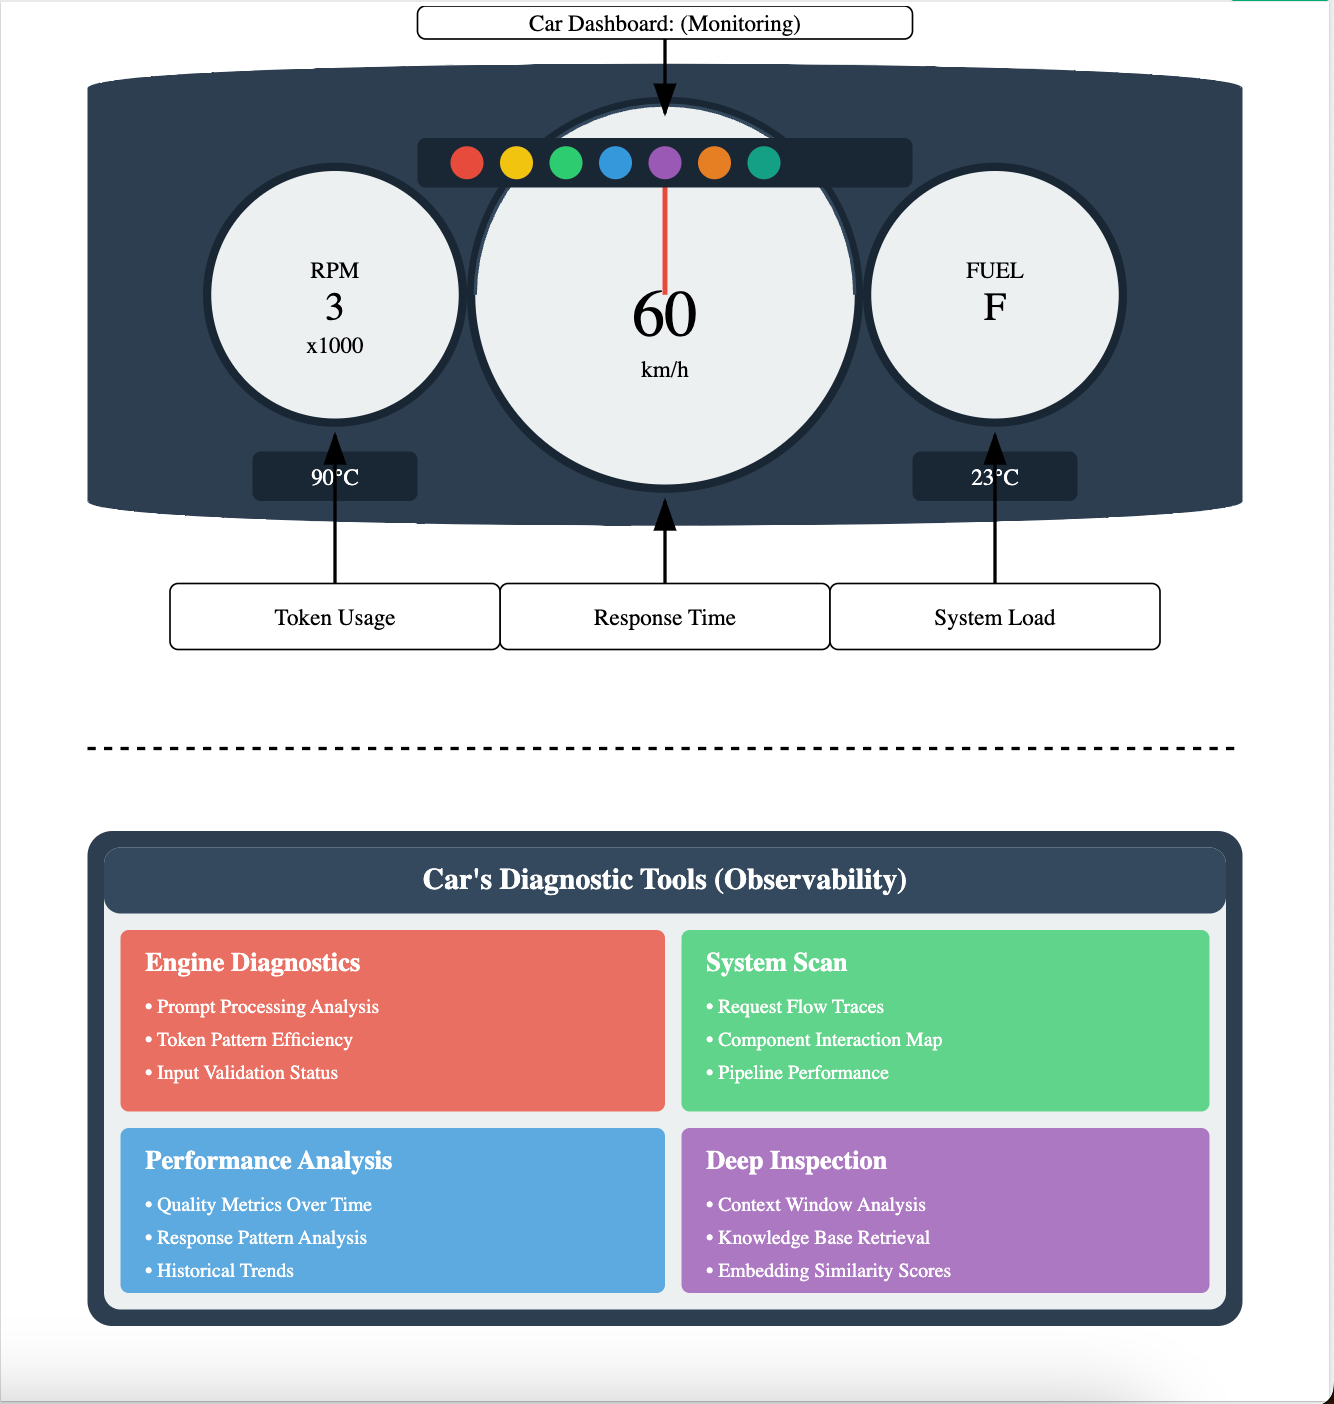
In your SRE work, you're an expert in monitoring. You use tools like ELK and New Relic to track known metrics: CPU utilization, error rates, network latency. This is like looking at a car's dashboard—it tells you your speed, fuel level, and if the engine is overheating. It's essential for tracking "known unknowns."
LLM security, however, is rife with "unknown unknowns." An application can be returning a 200 OK status, have low latency, and show no errors, yet be actively manipulated by a prompt injection attack. The model's output might be subtly altered, or it might be leaking data in a way that doesn't trigger a traditional alert.
This is where observability comes in. It's not just about monitoring pre-defined metrics; it's about collecting rich, high-fidelity data that allows you to ask arbitrary questions about your system's behavior to understand why something is happening. It's the difference between a dashboard and a full diagnostic toolkit.
So, what does this mean for LLMs?
LLM observability guide February 2026 - Openlayer
The article 'LLM observability: complete guide' provides a clear definition and explains why observability is different and more critical for AI systems compared to traditional software.
Please read the first two sections: 'What is LLM observability' and 'Why LLM observability matters for production AI systems'. Focus on how LLM failures (like hallucinations and prompt injections) differ from traditional software bugs and why this necessitates a shift from monitoring to observability.
As the article notes, LLM observability is about tracking the entire request lifecycle to reveal when models "drift, hallucinate, leak sensitive data, or fail quality thresholds." For security, it's our primary tool for detecting attacks that slip past our preventative layers.
2. The Foundation: What Telemetry to Capture
To enable threat detection, you must first collect the right data. Generic application logs are not enough. We need a detailed, structured record of every LLM interaction. Think of this as creating a flight data recorder for your AI.
The core components of LLM observability are often described using these primitives, which should be familiar from distributed tracing systems:
- Traces: Represent the entire end-to-end journey of a single request, from user input to final output. In a RAG application, this includes the retrieval step, the prompt construction, the LLM call, and any post-processing.
- Spans: Individual, named operations within a trace. For example, a
retrievalspan, anllm_callspan, and anoutput_filterspan. Each span has its own metadata, like duration and inputs/outputs. - Logs: The raw, unstructured (or structured) text data associated with a trace or span, such as the exact prompt and the model's full response.
- Events: Discrete occurrences within a trace that you want to flag, such as
GuardrailTriggeredorPIIDetected.
This short video from Langfuse gives a great visual of what a trace looks like in practice. Notice how it breaks down a RAG interaction into its constituent parts.
10 min Walkthrough of Langfuse – Open Source LLM Observability, Evaluation, and Prompt Management
This brief clip from the Langfuse walkthrough will help you visualize what a 'trace' is in the context of an LLM application.
Watch from 00:42 to 01:28. Pay attention to how the trace visualizes the entire flow, including document fetching, context encoding, and the final summary. This is the level of detail we need for security analysis.
Now, let's get specific. What data points are essential for security?
How to Set Up Prompt Injection Detection for Your LLM Stack
The article 'How to Set Up Prompt Injection Detection for Your LLM Stack' offers a fantastic, security-focused checklist of the data you must capture. We'll use this as our blueprint.
Read the section 'Essential Data Points to Capture'. This list is the foundation of a security-oriented observability strategy. As you read, think about why each data point is critical for detecting a prompt injection attack.
To summarize and expand on that list from a security perspective:
- User/Session Identifiers: To correlate activity over time. Is a specific user repeatedly trying to jailbreak the model?
- Full Prompt History: To detect multi-turn attacks where malicious instructions are built up across a conversation.
- System Instructions & Prompt Template: To see exactly what context the model was given. A successful attack often manipulates this context.
- Function/Tool Calls & Parameters: Absolutely critical. This is where you'd spot an LLM being tricked into calling
delete_user_datawhen the user just asked for a weather report. - Complete LLM Output (Pre-filtering): You need to see the model's raw response before your output filter sanitizes it. This tells you if the model was compromised, even if the user never saw the malicious output.
- Data Sources Accessed (for RAG): To trace indirect prompt injections back to their source. If an attack succeeded, was it because of a poisoned document in your knowledge base?
Capturing this data is the first step. The next is using it to find the signal in the noise.
3. Threat Detection: From Data to Actionable Alerts
With comprehensive telemetry in place, you can now define signals that indicate a potential attack. This is where your SRE mindset is invaluable—you're essentially writing detection rules for a new class of application behavior.
These signals are not simple error codes; they are behavioral and semantic anomalies.
How to Set Up Prompt Injection Detection for Your LLM Stack
This next section from the same article provides a catalogue of concrete anomaly signals to monitor. This is how we turn our logs into a real-time threat detection system.
Please read the sections 'Anomaly Signals in LLM Behavior' and 'Defining Alert Severity Levels'. These sections are the practical core of threat detection. Pay attention to the difference between direct behavioral anomalies (like role confusion) and response pattern anomalies (like high verbosity).
Let's put this into the context of our demo. You would configure your monitoring system (which we'll build with Langfuse) to alert on rules like these:
- Critical Alert:
- Signal: The model's output contains the exact phrase "Ignore all previous instructions."
- Indication: A classic prompt leak. The model is revealing parts of its system prompt, a clear sign of a successful jailbreak.
- High Alert:
- Signal: The model attempts to call a tool that is irrelevant to the conversation context (e.g., calling a financial API during a casual chat).
- Indication: Likely tool-use hijacking.
- Medium Alert:
- Signal: A single user session triggers the input guardrail (e.g., from Guardrails AI) more than 5 times in 10 minutes.
- Indication: A user is actively probing your defenses with known attack patterns.
- Low Alert (for Investigation):
- Signal: The model's response length for a summarization task deviates by more than 3 standard deviations from the established baseline.
- Indication: Could be a benign anomaly, or it could be a sign of the model entering an unusual state due to a subtle injection.
This tiered alerting strategy allows you to focus your attention on the most critical threats while still collecting data on lower-confidence signals for trend analysis.
This video clip reinforces the value of this approach, framing it as creating a central point for logging and reporting that provides visibility into your LLM's attack surface.
LLM Hacking Defense: Strategies for Secure AI
In this short clip, the speaker discusses the architectural benefits of a centralized proxy for security, highlighting the value of consistent logging and reporting.
Watch from 10:29 to 11:15. The speaker's point about having 'one place where I can look at the basic attack surface of my LLMs' is the ultimate goal of our observability strategy.
4. Incident Response: A Playbook for Prompt Injection
Once an alert fires, what do you do? A robust observability setup is the prerequisite for an effective incident response (IR). Without detailed logs, you are flying blind.
The IR plan for a prompt injection incident follows a standard, structured process that will be very familiar to you from your infrastructure work.
How to Set Up Prompt Injection Detection for Your LLM Stack
Finally, let's review a structured incident response plan tailored specifically for prompt injection. This closes the loop from detection to remediation.
Read the section 'Incident Response: When Prompt Injection is Detected'. Focus on the four main phases: Immediate Response, Evidence Collection, Analysis, and Post-Incident Activities.
Here's how this playbook would work for our project:
- Detection & Alerting: A
Critical Alertfires. Your system detected that the chatbot's output contained a fragment of its own system prompt. - Immediate Response (Containment): Your first step might be to temporarily isolate the user's session to prevent further interaction.
- Evidence Collection: You pull up the full trace for the incident in Langfuse. You have the user's entire conversation history, the exact prompt that caused the leak, the model parameters used, and the raw LLM output.
- Analysis & Investigation:
- Confirmation: You confirm the leak is real and not a false positive.
- Root Cause Analysis: You see that the user employed a novel payload splitting technique across three turns, which your input filter didn't catch. The attack bypassed your runtime guards because it didn't use any tools.
- Impact Assessment: You review the logs to see if any other sensitive data was leaked or if any malicious actions were taken in the same session. In this case, only the prompt was leaked.
- Continuous Improvement (The Feedback Loop):
- You update your input filter's regex to detect the new payload splitting pattern.
- You add the attacker's prompt-response pair to an evaluation dataset to test against future versions of your application.
- The incident and its resolution are documented and shared with the team.
This complete cycle—from data collection to detection to response and improvement—is the hallmark of a mature security operation. It's the story you want to tell in your professional demo.
Conclusion
Today, we've established the critical role of observability as the "sensing" layer in our defense-in-depth strategy. It's not just a passive logging system; it's an active, intelligent framework for threat detection and response.
Key Takeaways:
- Observability vs. Monitoring: Monitoring tracks knowns; observability lets you investigate unknowns. For LLMs, where failures are often semantic and silent, observability is non-negotiable.
- Data is the Foundation: Effective detection relies on capturing detailed telemetry, including full prompt/response chains, tool calls, and data provenance, all organized into traces and spans.
- From Data to Signals: We turn raw telemetry into actionable intelligence by defining alerts based on behavioral and semantic anomalies, not just system errors.
- Closing the Loop: A structured incident response plan uses observability data to not only contain threats but also to perform root cause analysis and continuously improve the security posture.
You now understand the "what" and "why" of LLM security observability. You can articulate why it's essential for catching the attacks that your other defenses will inevitably miss.
Next Up:
We will move from theory to practice. In our next lesson, we will get hands-on and integrate Langfuse into our application to collect full traces of prompts, responses, and intermediate steps. We'll be building the very foundation we discussed today, setting the stage for creating dashboards and analyzing real attacks.